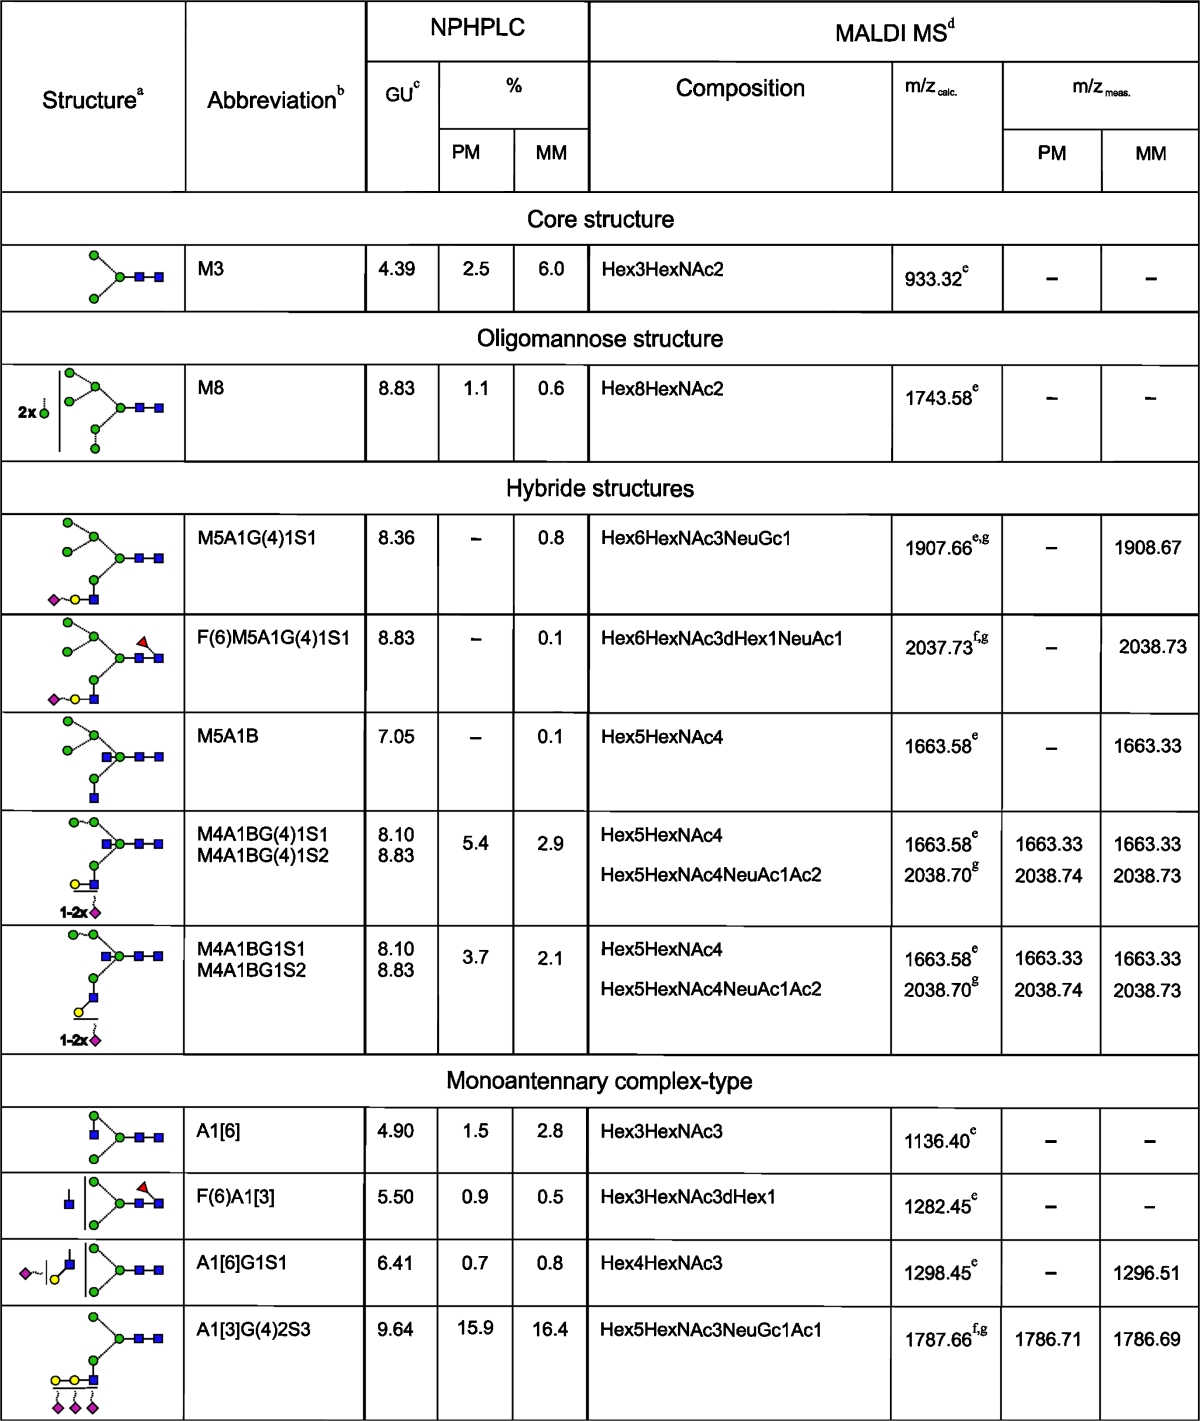
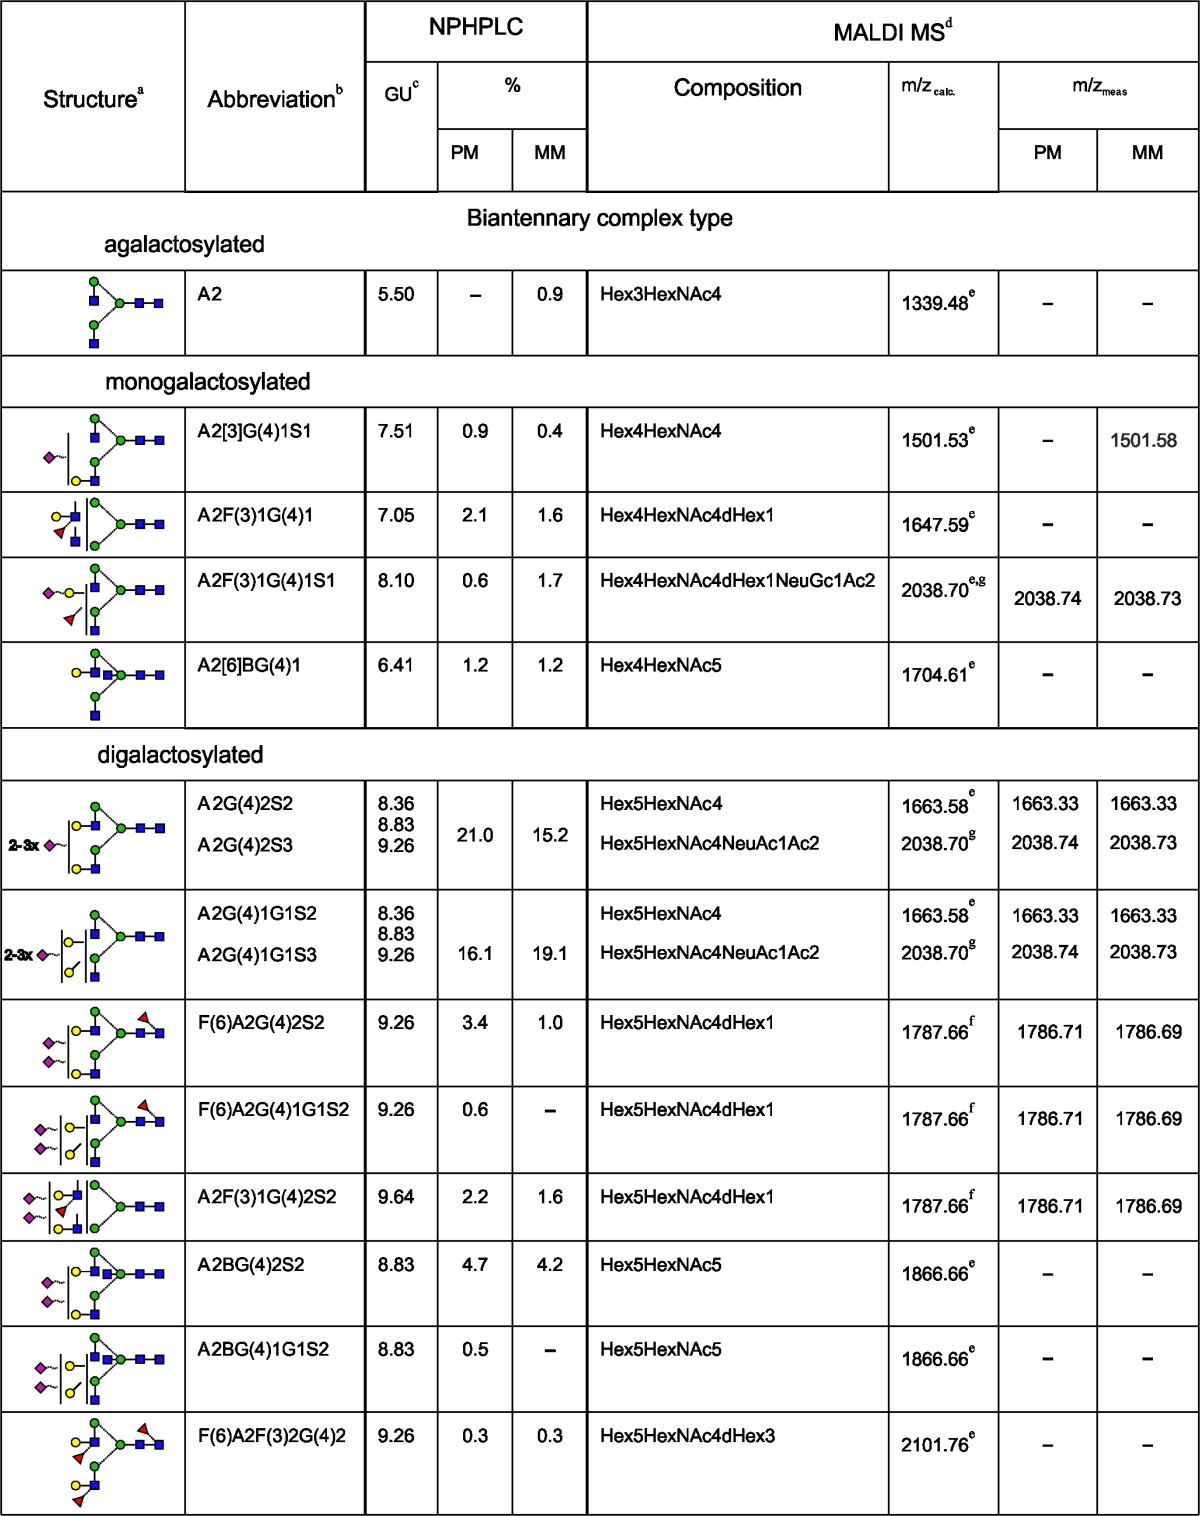
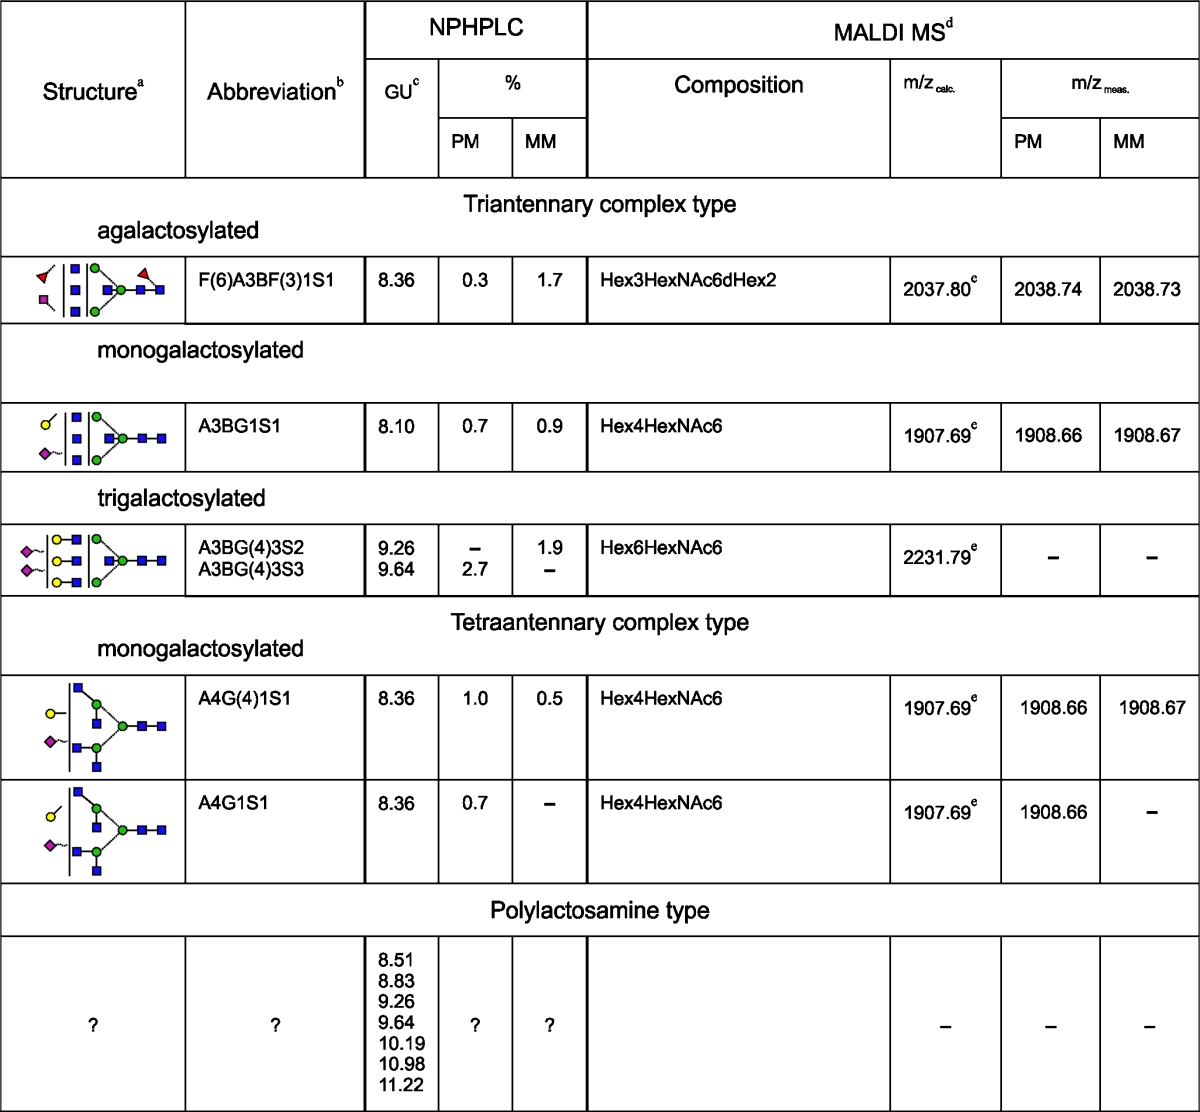
Table 1.
N-linked oligosaccharides in primary and metastatic melanoma L1CAM


PM, data for oligosaccharides of L1CAM from primary melanoma cells; MM, data for oligosaccharides of L1CAM from metastatic melanoma cells; +, the presence of corresponding structure in L1CAM; −, the absence of corresponding structure in L1CAM
aSymbol representation of glycans as follows: , GlcNAc;
 , mannose;
 , galactose;
 , fucose;
 , sialic acid; beta linkage, solid line; alpha linkage, dotted line; 1-4 linkage, horizontal line; 1-3 linkage, (/); 1-2 linkage, vertical line; and 1-6 linkage, (\)
bStructure abbreviations were used as in Fig. 2
cThe corresponding structure is coeluted with a structure of similar GU except structures: M3, A1[6], F(6)A1 and M3, A1[6] in case of L1CAM from primary and metastatic melanoma cells, respectively
dData for desialylated oligosaccharides
e[M+Na]+
f[M+H]+
gStructure resulted from partial digestion
No determination of the sialic acid linkage can be drawn from NPHPLC and MALDI MS data
