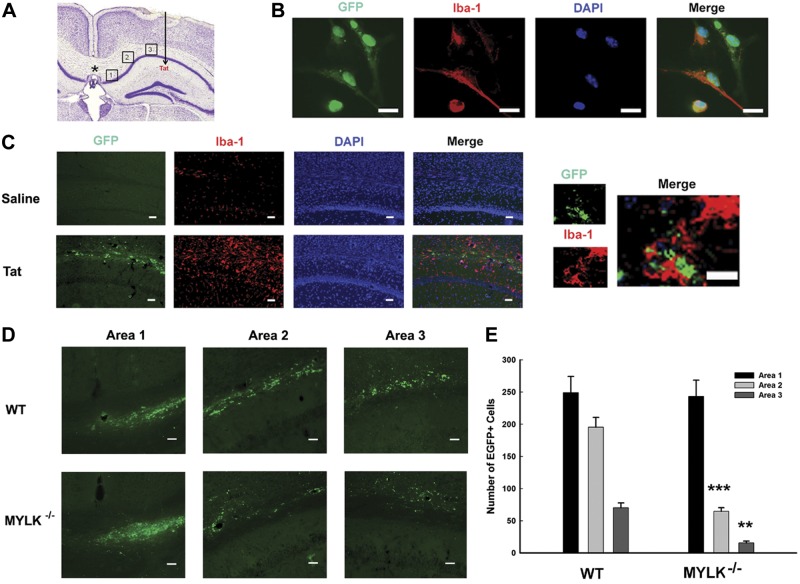
Figure 8.
Chemotactic responses of GFP-labeled microglia in vivo. A) Schematic diagram showing in vivo locations of GFP-labeled microglial transplantation (asterisk) and Tat injection (arrow). The 3 areas chosen for analysis of GFP+ microglial migration are indicated. B) Representative images of immunostaining for Iba-1 and GFP-labeled cells in vitro. C) Effect of Tat on microgliosis in the hippocampus. Representative image following 7 d intrahippocampal injection of saline or Tat immunostained for Iba-1 and GFP-labeled microglia (left panel) and the merged staining for GFP and Iba-1 (right panel). D) Representative GFP+ microglia in the 3 areas. Top panel: Tat and WT microglia. Bottom panel: Tat microglia from MYLK−/− mice. E) Quantification of GFP+ microglia in areas 1–3; n = 6 animals/group. Scale bars = 20 μm. **P < 0.01, ***P < 0.001 vs. WT group.

