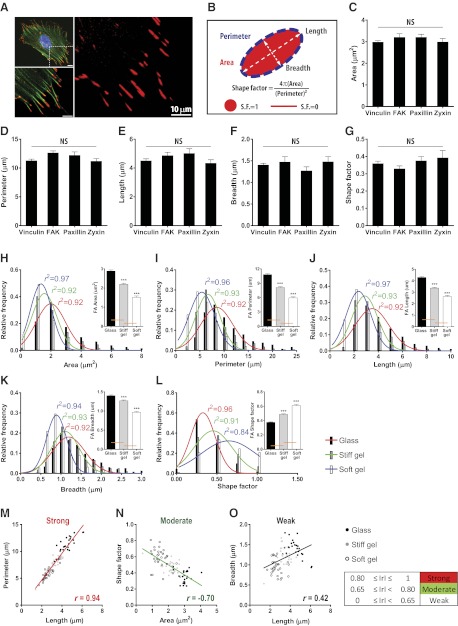
Figure 1.
Relationships among descriptors of focal adhesion morphology. A) Organization of actin filaments and focal adhesions in an MEF lying on a collagen-coated glass substrate. F-actin (green), nucleus (blue), and vinculin-marked focal adhesions (red) are imaged with a confocal microscope ×60. Details of actin filaments and associated focal adhesions in the region of interest are shown. Focal adhesions are elongated in the same direction of corresponding actin stress fibers. Scale bars = 10 μm. B) Schematic defining the morphological descriptors of focal adhesions used in this study. C–G) Area (C), perimeter (D), length (E), breadth (F), and shape factor (G) of focal adhesions stained with anti-vinculin, anti-FAK, anti-paxillin, and anti-zyxin antibodies. More than 20 cells were analyzed for each condition; values were averaged per cell. Error bars represent sem of averaged values; 1-way ANOVA using Bonferroni post test was applied to compare all possible pairs of conditions. No significant difference in morphological parameters from different focal adhesion staining was detected. H–L) Changes in area (H), perimeter (I), length (J), breadth (K), and shape factor (L) of focal adhesions in response to changes in substrate stiffness: rigid glass (black), a stiff gel (gray), and a soft gel (white). Distributions of these descriptors for different substrate compliances are plotted with color-coded gaussian fits: glass (red), stiff gel (green), and soft gel (blue), respectively, and the same color-coded coefficients of determination (r2) are shown in each plot. Higher average values show broader distributions. More than 900, 600, and 200 focal adhesions were analyzed for glass, stiff gel, and soft gel, respectively, from ≥30 cells/condition. Error bars indicate sem, and statistical differences were calculated using the unpaired t test. ***P < 0.001. M–O) Representative strong (M), moderate (N), and weak (O) correlations among descriptors of focal adhesion morphology. Length of focal adhesions is positively correlated with perimeter and breadth but to different extents (M, O). Size (i.e., area) of focal adhesions in cells is anticorrelated with shape factor (N). Data points are the averaged values from each cell. Degree of correlation is assessed by the Pearson product moment correlation coefficient (denoted by r). Straight line in each plot shows a linear regression of analyzed data set. Red, green, and black colors represent strong (0.80≤|r|≤1), moderate (0.65≤|r|<0.80), and weak (|r|<0.65) correlations; + and − denote positive and negative correlations, respectively. Correlation assessment and linear regression are applied to the merged data sets regardless of substrate stiffness. Correlation coefficients among all pairs of morphological parameters are summarized in Supplemental Fig. S1.

