
Figure 4.
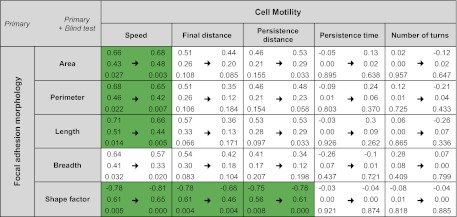
Summary of correlations between focal adhesion morphology and cell motility. Pearson correlation coefficient r, r2, and P values are calculated (top, middle, and bottom, respectively) between focal adhesion morphology (area, perimeter, length, breadth, and shape factor) and cell motility (speed, final distance, persistence distance, persistence time, and number of turns) in primary data set (left) and blind test results included data set (right). Data in green represent moderate (0.65≤ |r| <0.80) correlations; + and − denote positive and negative correlations, respectively. Focal adhesion size (denoted by area) correlates with cell speed, but the magnitude is not very high (r=0.66 or 0.68). Blind test results do not substantially disturb the degree of correlations determined by the primary data set.