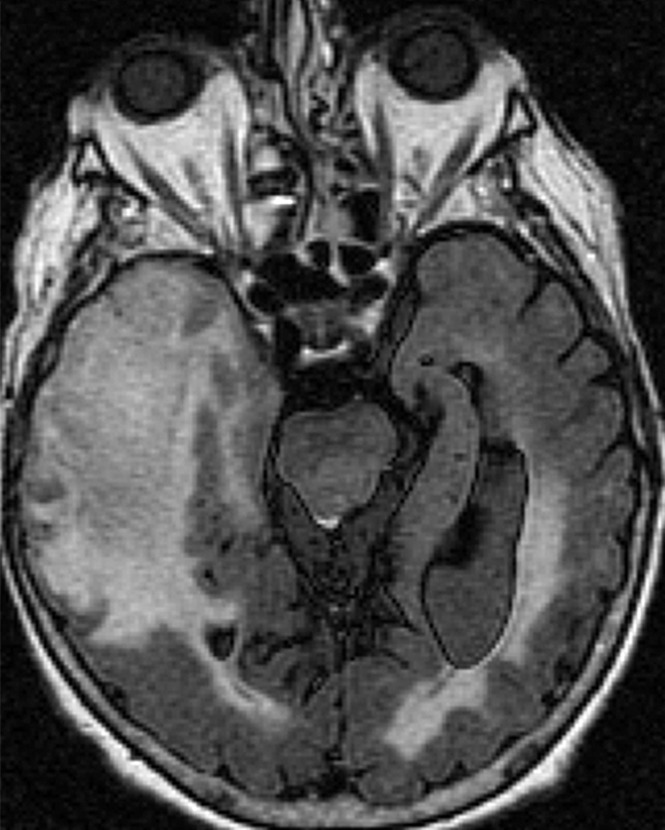
Figure 1b:

Axial (a) contrast-enhanced T1-weighted and (b) fluid-attenuated inversion recovery images in a patient with right temporal GBM. Cerebral blood volume parametric maps at the same axial level show (c) manually drawn region of interest including contrast-enhanced tumor avoiding any cystic necrotic part to measure rCBVmean and (d) region of interest (arrow) drawn to measure rCBVmax from the “hottest” part of the tumor and three other regions of interest (arrowheads) drawn to measure CBVNEL.
