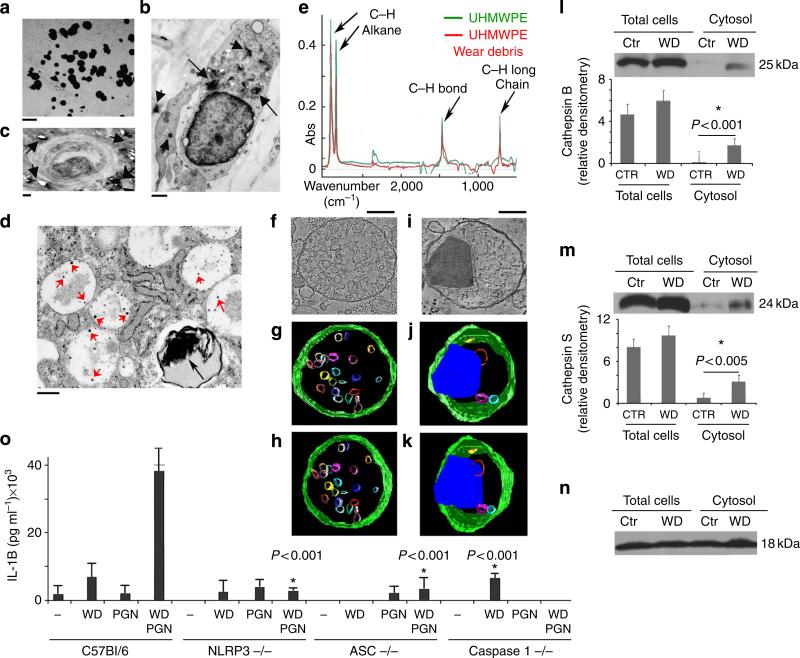
Figure 1. NLRP3 inflammasome activation by phagocytosed WD particles.
(a) Transmission electron micrograph of nanometre and micrometre size WD recovered from the periprosthetic tissue of patients undergoing joint revision surgery. Bar corresponds to 1 μm. (b) ultrastructural analysis of micrometre size WD particles (arrows) phagocytosed by myeloid mononuclear cells present in periprosthetic tissue. Bar corresponds to 1 μm. (c) ultrastructural analysis of micrometre size WD particles (arrows) next to a blood vessel in periprosthetic tissue. Bar corresponds to 1 μm. (d) ultrastructural analysis of nanometre and micrometre size WD particles (arrows) phagocytosed by a myeloid mononuclear cells present in periprosthetic tissue. Bar corresponds to 500 nm. (e) FTIR spectroscopic analysis of pre-implant UHMWPE and commercially available UHMWPE particles. The analysis was carried out between 4,000 and 500 cm2 wave number. (f) Two-dimensional electron micrograph cross-section and (g,h) 3D models derived from 200-nm–section tomograms of an untreated dendritic cell. (g) The late endosome multivesicular body presents a definitive spherical shape and well-defined limiting membrane. (h) The model is rotated 25 ° relative to (g). (i) 2D electron micrograph cross-section of a micrometre size WD particle phagocytosed by a cultured dendritic cell, and (j,k) 3D tomographic reconstruction of the same (j) WD particle inside the endosomal compartment. (k) The model is rotated 25 ° relative to (j). (l,m,n) Western blotting for (l) cathepsins B, (m) cathepsin S, and (n) cyclophilin (loading control), from control (Ctr) and WD-particles-treated dendritic cells. Bar graphs represent average and s.e.m. of three independent western blots, P < 0.001 and P < 0.05 values, respectively, ANOVA, Tukey (o) ELIsA for IL-1β secretion from dendritic cells (control, NLRP3, ASC and caspase-1 knockout mice) untreated or treated for 12 h with WD particles (100 μg ml–1), PGN (a TLR2 agonist, at 10 μg ml–1), or WD and PGN combined. The average and s.e.m. of three experiments is shown; asterisk indicates a statistically significant (P < 0.001, ANOVA, Tukey) decrease in IL-1 production in NLRP3, ASC and caspase 1 knockout mice as compared with C57Bl/6 controls.

