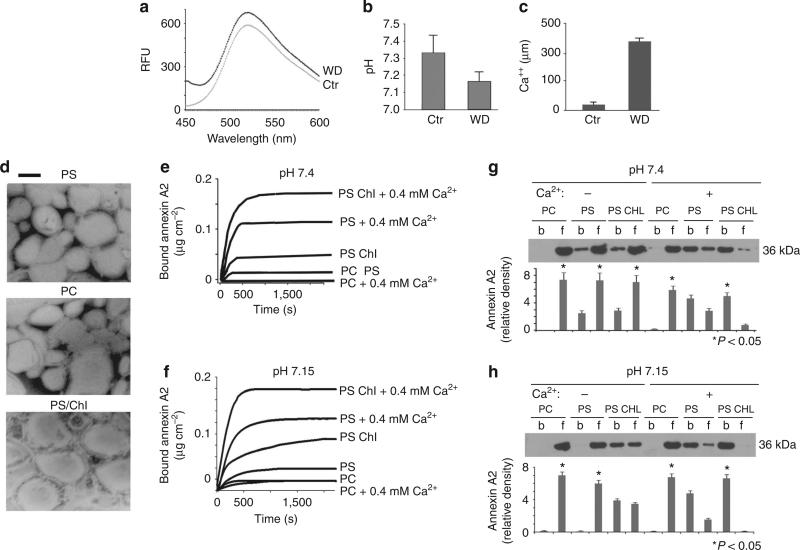
Figure 5. WD exposure reduces pH and increases Ca++ levels in cytosol of DC.
(a) Lysosensor green fluorescent pH measurement of cytosol isolated from control and WD-treated cells (one out of three experiments is shown). (b) microelectrode pH measurement of media from control and WD particle-treated cells. (mean + s.e.m. were calculated from five different experiments., P < 0.05, ANOVA, Tukey) (c) Calcium measurement in the cytosol from control and WD particle-treated cells. (mean + s.e.m. were calculated from three different experiments., P < 0.001, ANOVA, Tukey) (d) Electron micrograph of negative staining of various liposomes prepared for ellipsometry studies. Bar corresponds to 100 nm. (e,f) Ellipsometry tracings of annexin A2 binding to liposomes under a variety of conditions. (e) Ellipsometry tracing shows annexin A2 (5 μg ml–1) binding to various phospholipid bilayers at physiological pH in the presence or absence of Ca++, (1 out of 4 different experiments is shown). (f) ellipsometry tracing displays annexin A2 (5 μg ml–1) binding to various phospholipid and cholesterol bilayers at acidic pH in presence or absence of Ca++ (1 out of 4 different experiments is shown). (g,h) Western blot analysis, with related densitometric analysis, of liposomes incubated with annexin A2 in the presence or absence of Ca++ and at different pH values, and subsequently pelleted by ultracentrifugation (b = bound and f = free or unbound annexin A2), (mean + s.e.m. were calculated from 4 different experiments., P < 0.05, ANOVA, Tukey).

