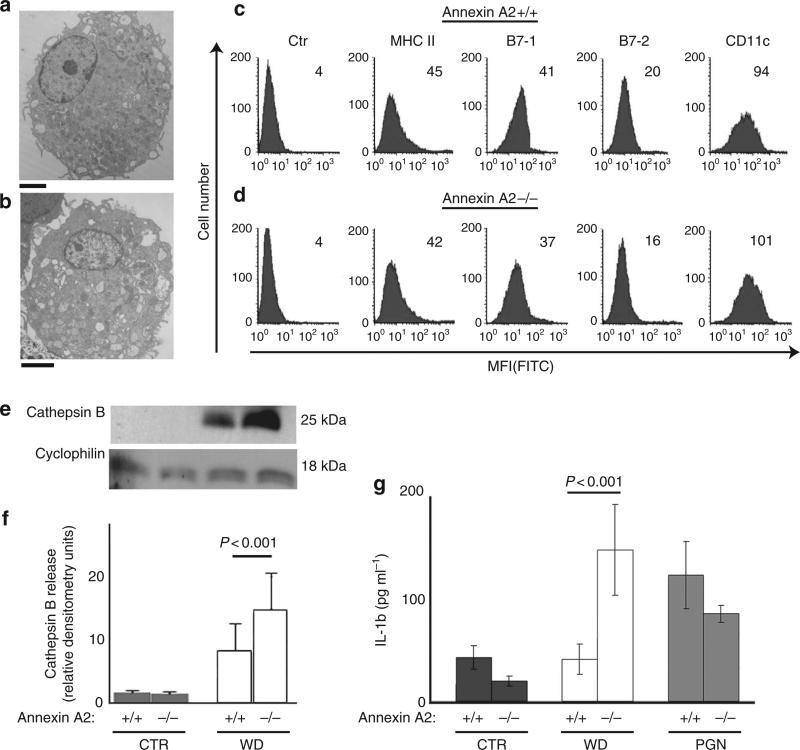
Figure 6. Increased inflammasome activation in annexin A2 knock out mice.
(a) ultrasctructural analysis of annexin A2 + / + DC. Bar correspond to 2 μm. (b) ultrasctructural analysis of annexin A2 – / – DC. Bar correspond to 2 μm. (c) FACs analysis of DC surface markers on annexin A2 + / + DC. (d) FACs analysis of DC surface markers on annexin A2 – / –DC. (e) Western blot analysis and (f) densitometry analysis of cytosolic cathepsin B in control CTR and WD-treated DC. The mean and s.e.m. of three experiments is shown (P < 0.001, ANOVA, Tukey). (g) ELISA for IL-1β secretion from untreated and WD-treated DC (12 h), and from wild type DC and DC deficient in PGN (a TLR2 agonist). The mean and s.e.m. of four experiments is shown (P < 0.001, ANOVA, Tukey).

