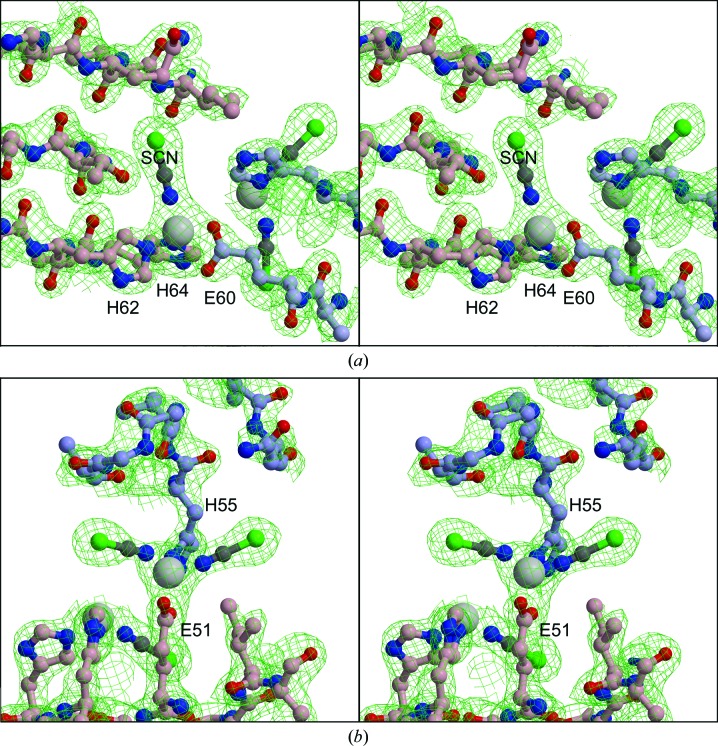
Figure 3.
Stereoviews of electron density around metal-binding sites. (a) Cobalt 1 (large gray sphere, B101 in the PDB file) and surroundings. Thiocyanate is modeled as a ball-and-stick representation, with its N atom binding to the cobalt ion. (b) Cobalt 2 (A102) with two thiocyanate ions. Selected residues of the protein are shown with blue-gray (chain A) or pink (chain B) C atoms. Co atoms 3 and 4 (A101 and B102) are symmetry-related to these two. The map is a 2F o − F c map is contoured at 0.58 e Å−3 (1.5σ). The figures were generated with the programs O (Jones et al., 1991 ▶), MolScript (Kraulis, 1991 ▶) and Raster3D (Merritt & Murphy, 1994 ▶).

