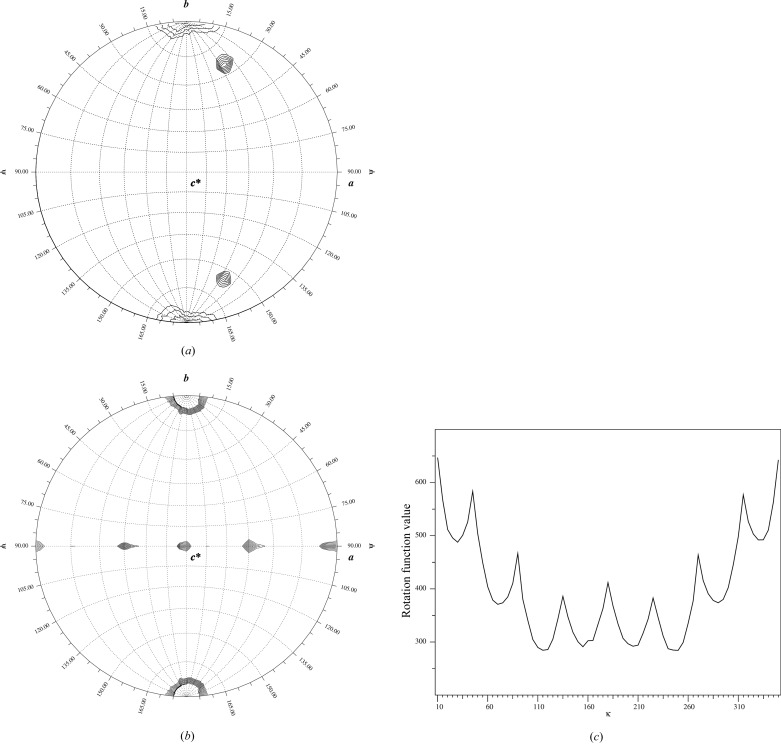
Figure 4.
NCS analysis of the diffraction data. (a) The stereographic plot of the self-rotation function calculated with κ = 45°, using the program GLRF (Tong & Rossmann, 1997 ▶). Apart from the peak at the origin, the two peaks at (ϕ, ψ) = (41°, 25°) and (41°, 155°) are symmetry-related to each other, which corresponds to a local eightfold axis. (b) Self-rotation function calculated with κ = 180°, showing the local twofold axes, which are ψ = 90° with an interval of 45°. The maps are contoured at 4.04σ (a) and 2.0σ (b) in steps of 0.1σ. (c) The one-dimensional κ plot showing the intensity of the self-rotation function with (ϕ = 41°,ψ = 25°) for κ between 10 and 350°. The origin peak is truncated for clarity.

