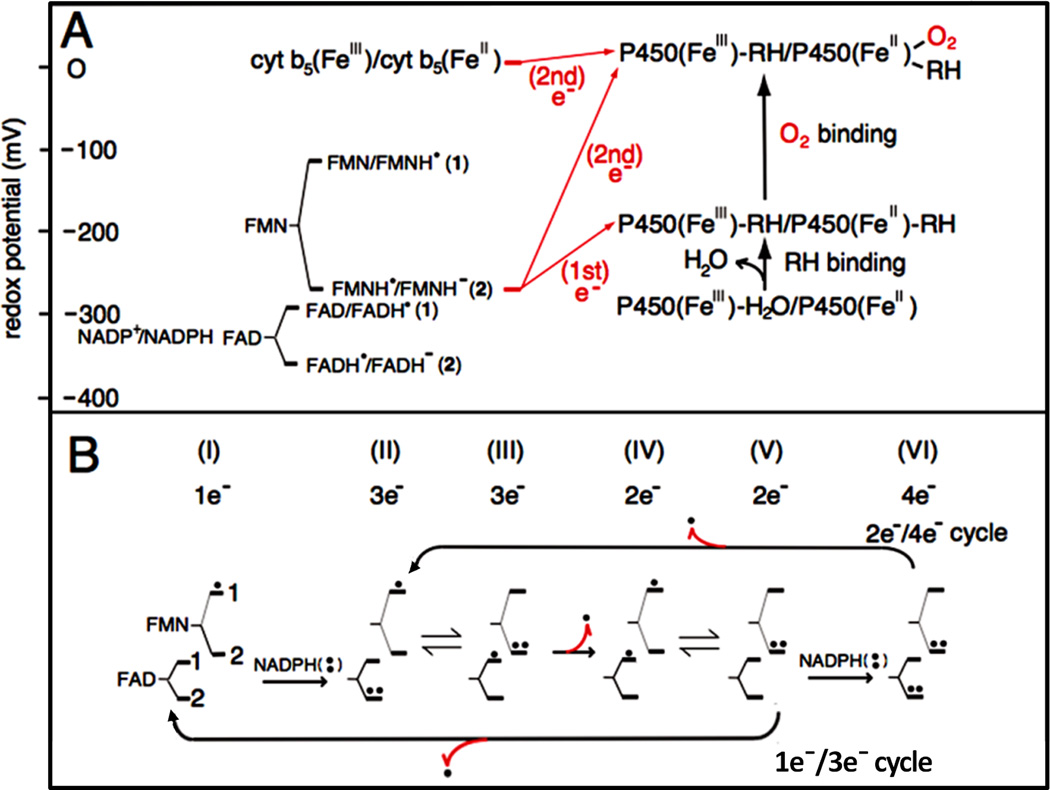
Figure 10.
Redox potentials of the individual redox couples of FAD and FMN of CYPOR and P450 (A), and the catalytic cycle of CYPOR (B). A and B, 1 and 2 indicate the redox pairs shown in A [84, 92]. B, Dots indicate electron equivalents, one-electron (.) and two-electron (..) -reduced states. Numbers under I through VI indicate the total electrons present in the two flavins. Red arrows with dot (.) indicate one-elctron donation/release.

