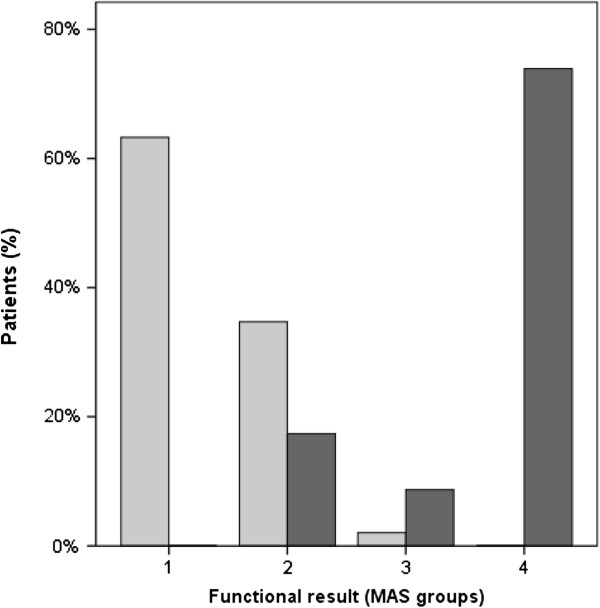
Figure 1.
Correlation between radiological outcome and MAS. The percentage share of patients with good radiological outcome is shown with the light grey columns. The percentage share of patients with radiological joint degeneration (Helfet, Brooker, Ficat/Arlet stadium 3 and 4) is shown with the dark grey columns. MAS groups were defined as group 1 (no functional limitations (18 points), group 2 (slight limitations (15–17 points)), group 3 (moderate limitations (13–14 points)) and group 4 (severe limitations (<13 points)).

