
Figure 1.
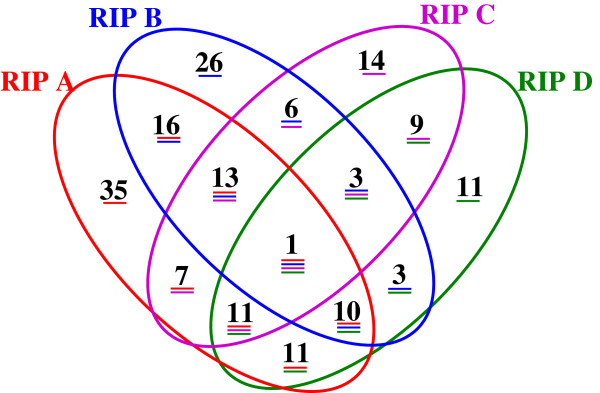
Venn diagram showing marker overlap across four RIL mapping populations. A four-way Venn diagram illustrating all unique, two-way, three-way and four-way sets of shared markers. The mapping populations are abbreviated as in the text: RIP A = ICMB 841-P3 × 863B-P2; RIP B = H 77/833-2 × PRLT 2/89-33; RIP C = 81B-P6 × ICMP 451-P8; RIP D = PT 732B-P2 × P1449-2-P1.