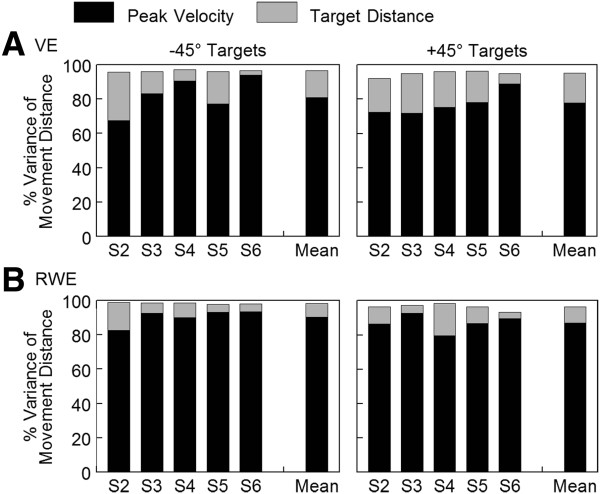
Figure 10.
Percent variance in movement distance accounted for by peak velocity and target distance. Data shown for each individual participant reaching in both directions in the virtual environment (VE) (A) and the real-world environment (RWE) (B). Group means are at the right of each plot. The height of the black portion of the bar represents the variance in movement distance explained by peak velocity. The top portion of the bar represents the additional variance in movement distance explained when target distance is added to the regression model (see Figure 2). The overall height of the bar represents the total variance accounted for by the two factors combined (peak velocity, target distance).

