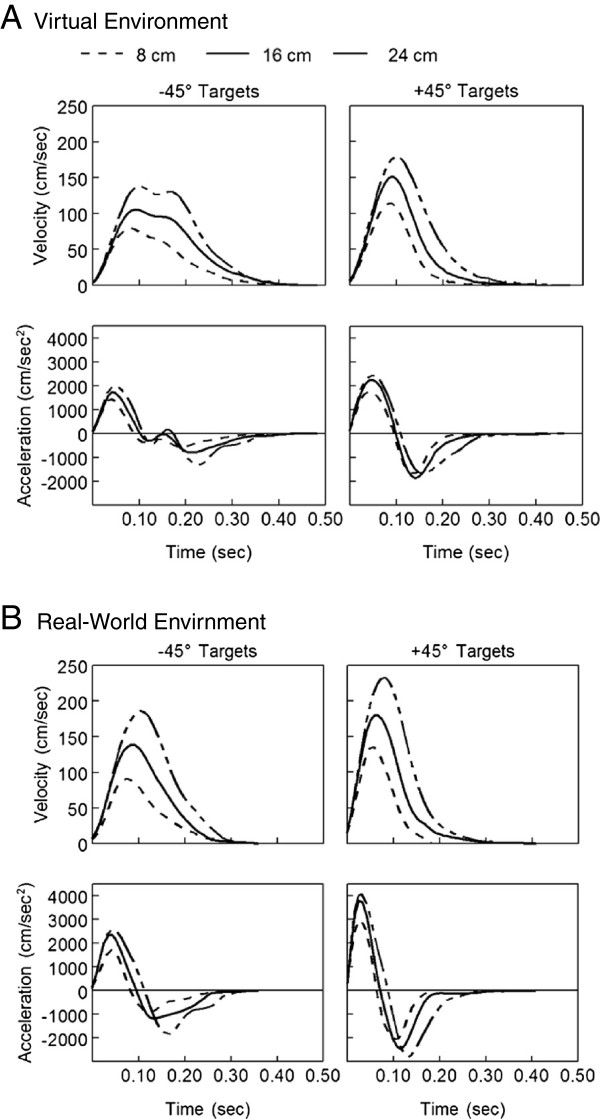
Figure 5.
Mean velocity and acceleration trajectories for one participant reaching in both environments. Mean velocity and acceleration profiles are shown for the virtual environment (A) and real-world environment (B). Each line represents an ensemble average of all trials to a specific target distance (8, 16, 24 cm) for the same participant shown in Figure 3.

