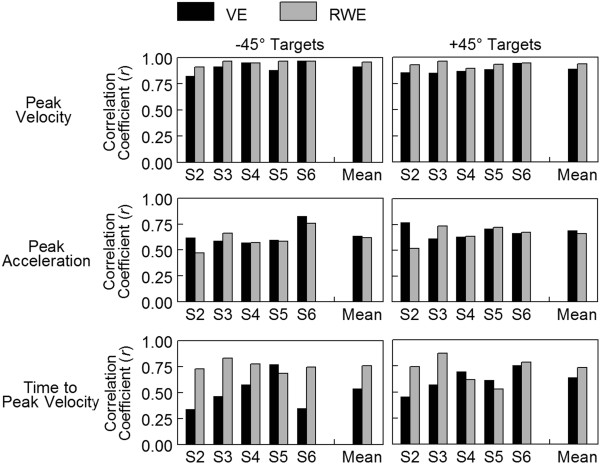
Figure 8.
Correlation of peak velocity, peak acceleration, and time to peak velocity with movement distance. Correlation coefficient r shown for each participant in the virtual environment (VE) and the real-world environment (RWE) reaching in both directions (+45°, −45°). Mean represents the average across all participants calculated with the transformed Fishers z scores.

