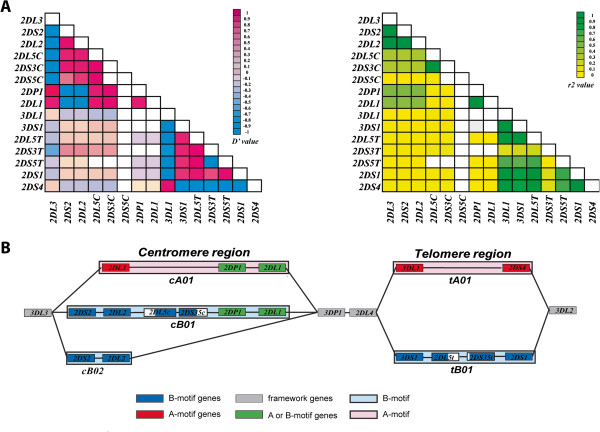
Figure 1.
Linkage Disequilibrium among KIR genes. (A) Two LD maps of the KIR region were constructed using Arlequin v3.5, comparing D’ and r2 values between pairwise combinations of the 16 KIR genes. Each block on the maps represent either the D’ (left map) or r2 (right map) value calculated. The two color keys indicate the range of values represented by different colors. Gene names are shown at the left and bottom of each map. (B) A cartoon representation of the KIR region, showing the combinations or blocks of KIR genes into commonly seen motifs. The color-coded key at the bottom indicates the motif or region that each gene is linked to, with the 2DL5-2DS35 block hatched to highlight both centromeric and telomeric residence.

