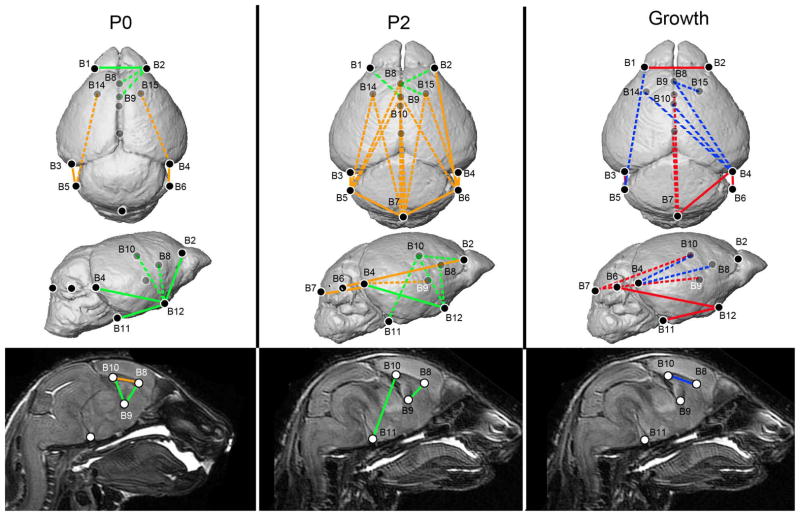
Figure 4.
Analyses of brain phenotypes in Fgfr2+/P253R mice relative to unaffected littermates. Results of form difference analysis of the brain at P0 (left) and P2 (middle), where white lines indicate linear distances that were increased in Fgfr2+/P253R mice and black lines indicate linear distances that were decreased in Fgfr2+/P253R mice relative to unaffected littermates. Results of growth difference analysis of the brain (right), where black lines indicate those linear distances that show greater magnitude of change from P0 to P2 in Fgfr2+/P253R and white lines indicate linear distances that show a decreased magnitude of change in the Fgfr2+/P253R mice. Ghosted landmarks and dashed lines indicate landmarks and linear distances that are deep to the surface of the 3D reconstruction. [Color figure can be viewed in the online issue, which is available at www.interscience.wiley.com.]

