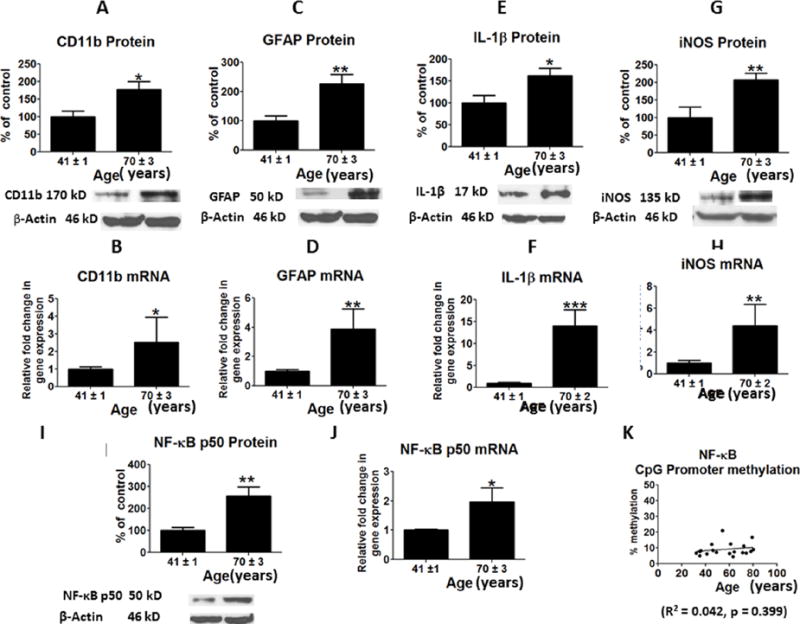
Figure 1.
Mean protein levels of neuroinflammatory markers (with representative immunoblots) are shown in Figure: A, Cd11b; C, GFAP; E, IL-1beta; G, iNOS and I, NF-kBp50. Bar graphs are ratios of optical densities of individual protein bands to β-actin, expressed as percent of control. Mean mRNA levels of neuroinflammatory markers are shown in Figure B, Cd11b; D, GFAP; F, IL-1beta; H, iNOS and J, NF-kBp50. mRNA levels in postmortem frontal cortex from the middle aged (n = 9) and aged subjects (n = 10), measured using quantitative RT-PCR. mRNA levels of Cd11b;, GFAP, IL-1beta, iNOS and NF-kBp50 in aged group normalized to the endogenous control (β-globulin) and relative to the control (calibrator), using the ΔΔCT method. CpG promoter methylation of NF-kBp50 is shown in Figure 1K. Values are Mean ± SEM and t-tests are used to compare old vs. middle age groups. * p < 0.05, ** p < 0.01, *** p < 0.001 as compared to middle aged group.

