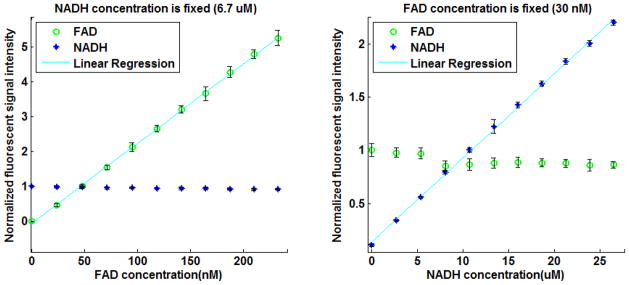
Figure 2.

Sensitivity curves of the Fluorometer to changes in a) FAD and b) NADH concentration in an aqueous solution. All intensities are normalized to the signal level obtained at a concentration equal to that in lung tissue. Solid lines are linear regression fits (r2 = 0.999 and 0.998 for NADH and FAD, respectively). The range of NADH and FAD concentrations studied encompassed the NADH and FAD concentrations in lung tissue [23].
