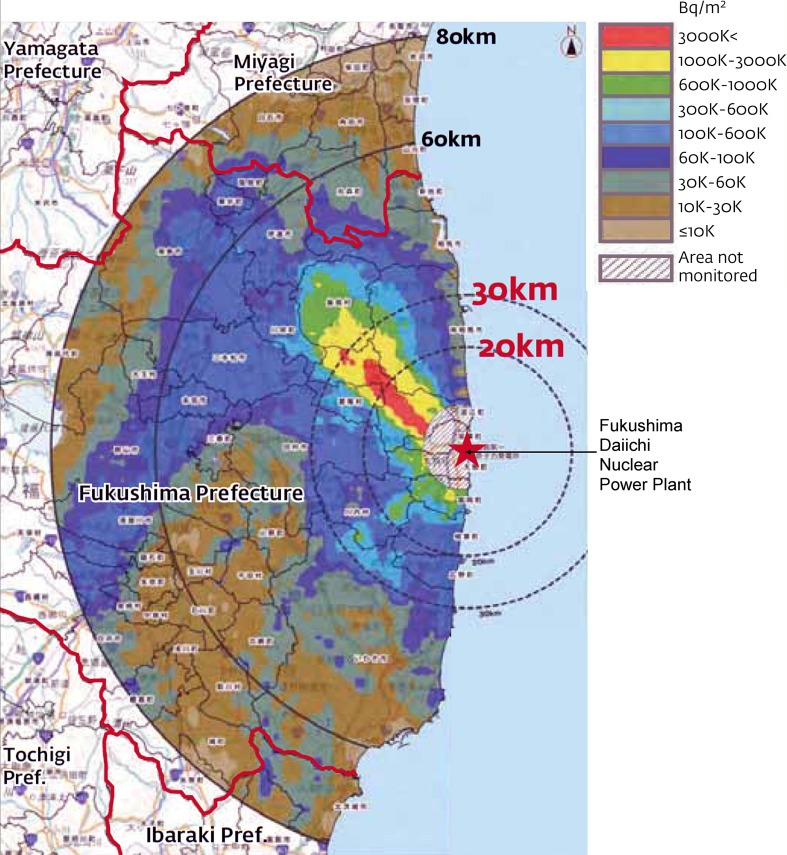
Fig. 18.
Map of accumulated deposits of Cesium-137 as of July 2, 2011 (NAIIC 2012). The red-colored areas correspond to deposits of cesium in excess of 3 MBq/m2; that is, levels that are similar to the levels found around Chernobyl, which, however, cover larger areas

