
Figure 6. The frequency of CD4+CD25+Foxp−IL-17+ cells is decreased in SAMP mice with established ileitis.
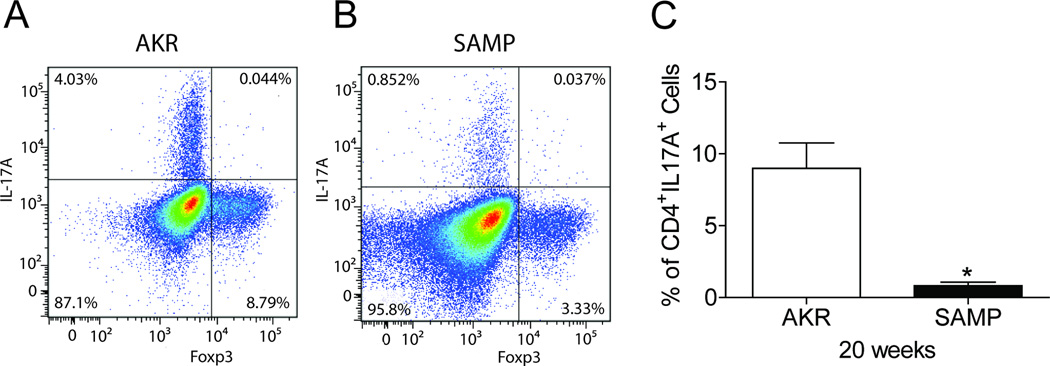
Representative CD4+ T cell-gated dot plots showing percentages of Foxp3+ and Foxp3− T cells expressing IL-17A in MLN of (A) control AKR and (B) SAMP mice at 20 weeks. (C) Composite bar graph representing a significant decrease in the percentage of CD4+ Foxp3− T cells expressing IL-17A in MLN of SAMP vs. AKR mice.; data are representative of 4 experiments performed separately. Data are expressed as the mean ± SEM (*P<0.02).