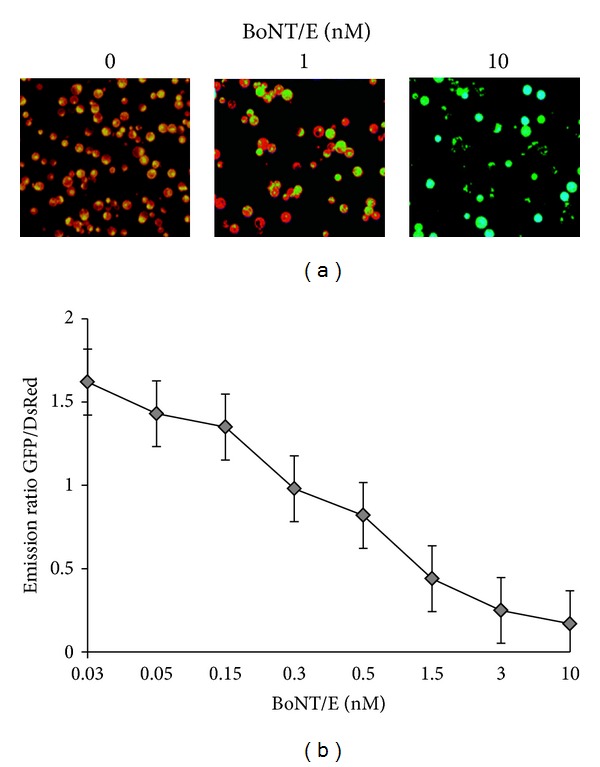
Figure 4.

(a) BoNT/E responses of the clone 3A14. PC12 cells were grown in 96 well plates treated with the indicated BoNT/E concentration for 72 h and imaged using fluorescence microscopy. Pseudocolored images indicate the distribution of the GFP/DsRED fluorescence ratio within the cells. (b) Monitoring BoNT/E activity using a microplate reader. The GFP and DsRED emissions were also collected by fluorescence microplate reader (BioTek). Emissions were plotted as a function of BoNT/A at 0.03, 0.05, 0.15, 0.3, 1.5, 3.0, and 10 nM concentrations. Data are presented as means ± SD (n = 3).
