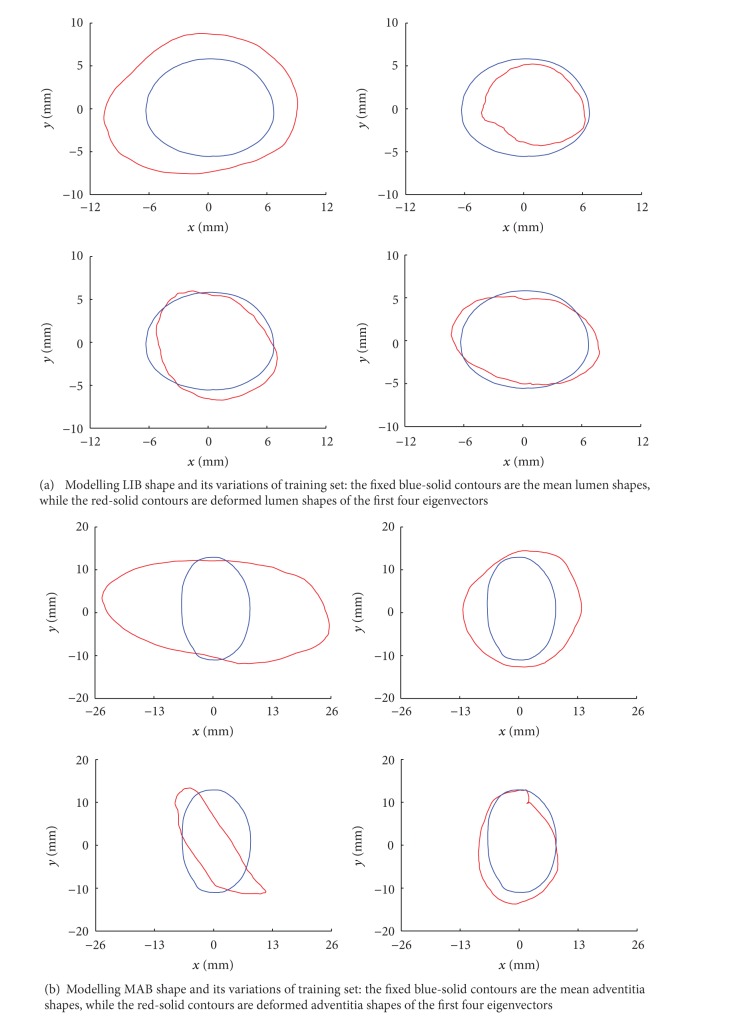
Figure 5.
Mean shapes in each panel are the fixed (in blue); the first four eigenvectors-corresponded deformed shapes are diverse (in red), because of the variety shapes of the LIB (a) and MAB (b) of training set. The units of both x- and y-axes of every subpicture are (mm). The training results are generated from three hundred and forty 2D CCA baseline images data. The blue contour is the average shape of baseline images data (training set), while the red one is the deformed shapes. The average shape contour would be superposed on follow-up images data (test set) as the initialization contour for ASM segmentation (refer to movie I in Supplementary Material available online at http://dx.doi.org/10.1155/2013/345968).

