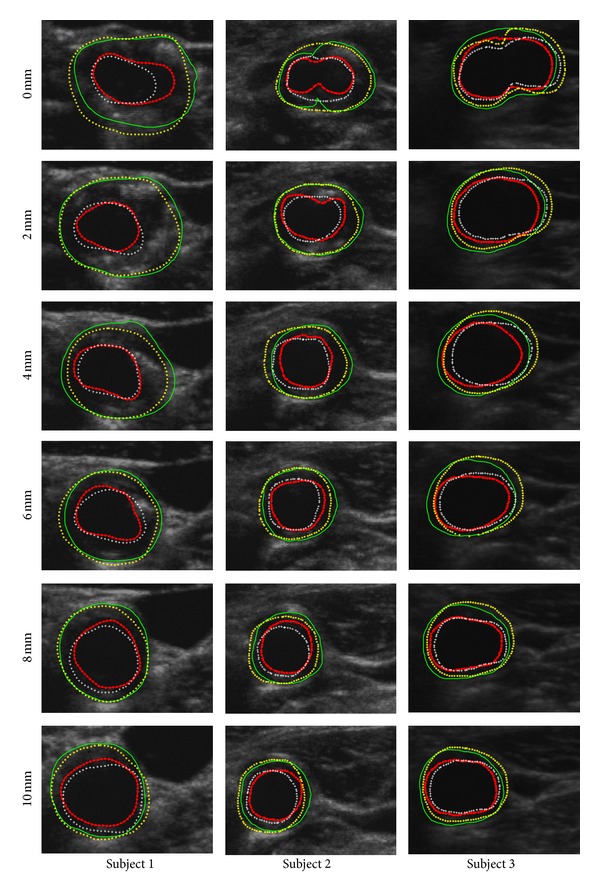
Figure 7.

In order to subjectively and objectively evaluate the performance between the proposed approach and manually method, both inner and outer contours are synchronized overlapped together. Green-solid-line outer contour and red-dotted-line inner contour represent manual MAB and LIB, respectively; while yellow-starred outer contour and white-plus-signed inner contour represent algorithm-generated MAB and LIB, respectively. Each column represents the images of individual patient. For each row from the top to the bottom, there are images at different distance of 0, 2, 4, 6, 8 and 10 mm from the slice to the bifurcation (BF).
