
Figure 3.
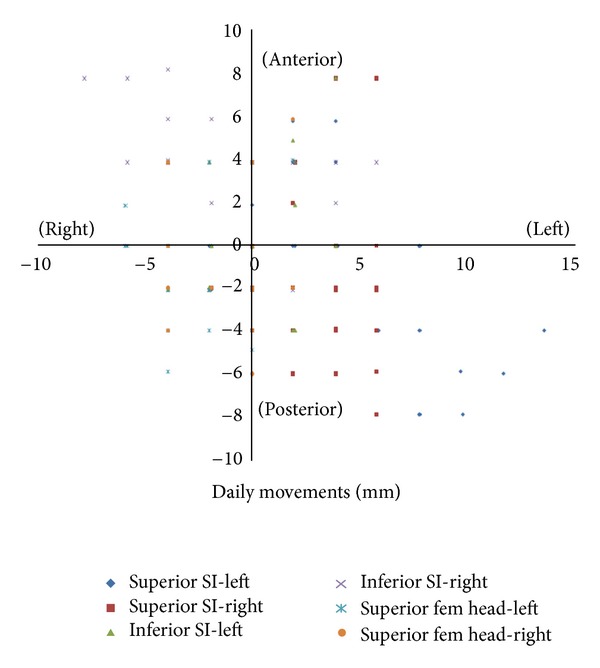
Movement data for a single patient. Movement data points of IV relative to their pretreatment location after image guided alignment to the prostate on each day of a 28-day treatment. This illustration represents a single patient data set based on all observations.