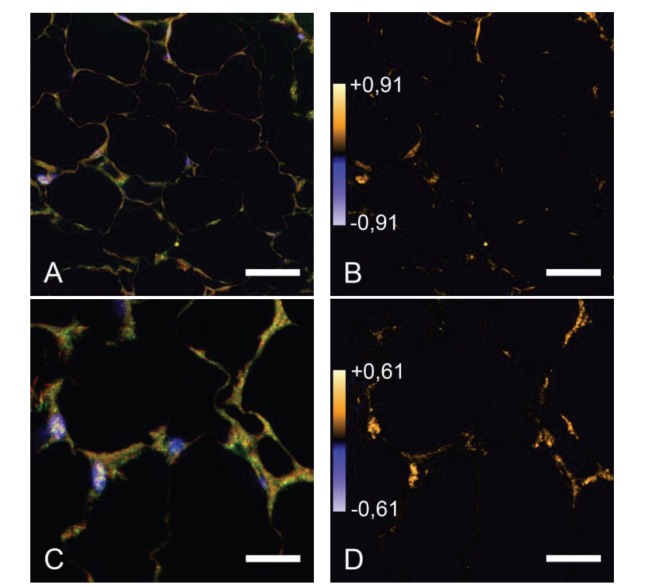
Figure 3.
Immunostaining of PTPIP51, insulin receptor, and PKA in adipocytes of standard diet animals. (A) Immunostaining of PTPIP51 and the insulin receptor. (B) Intensity correlation of PTPIP51 and the insulin receptor, high correlation is displayed in yellow. (C) Immunostaining of PTPIP51 and PKA. (D) Intensity correlation of PTPIP51 and the insulin receptor, high correlation is displayed in yellow; Bar (A): 60 μm; Bar (C): 15 μm.

