
Figure 1.
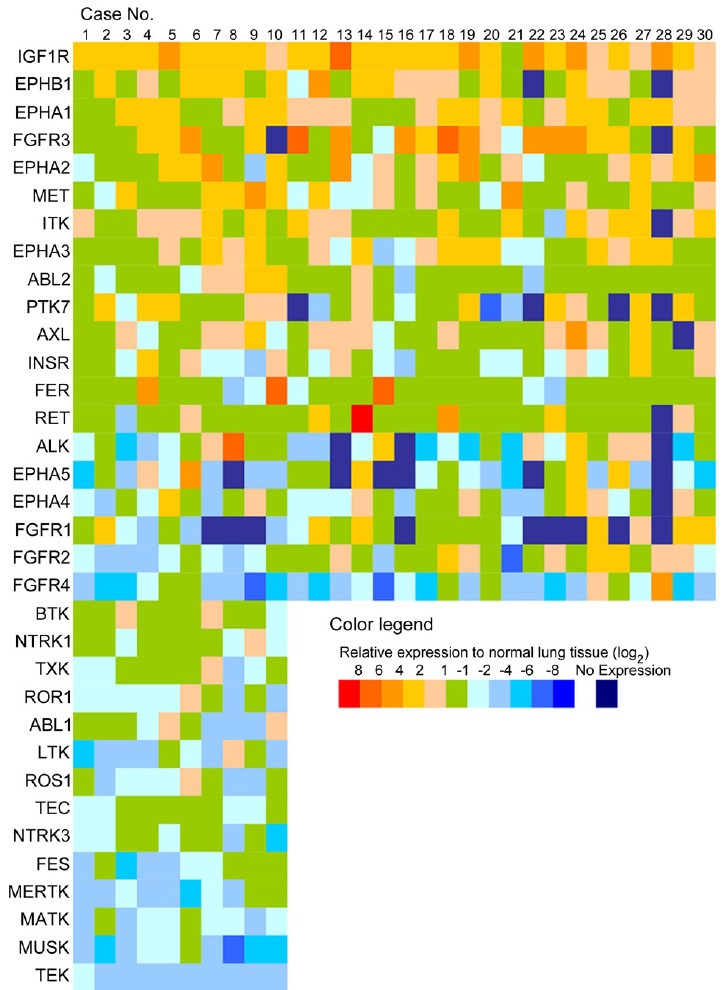
Relative expression level of the candidate genes in NSCLC clinical specimens, compared with normal lung tissue. The relative expression levels of the genes in NSCLC clinical specimens, compared with that in normal lung tissue, are shown according to the color legend.