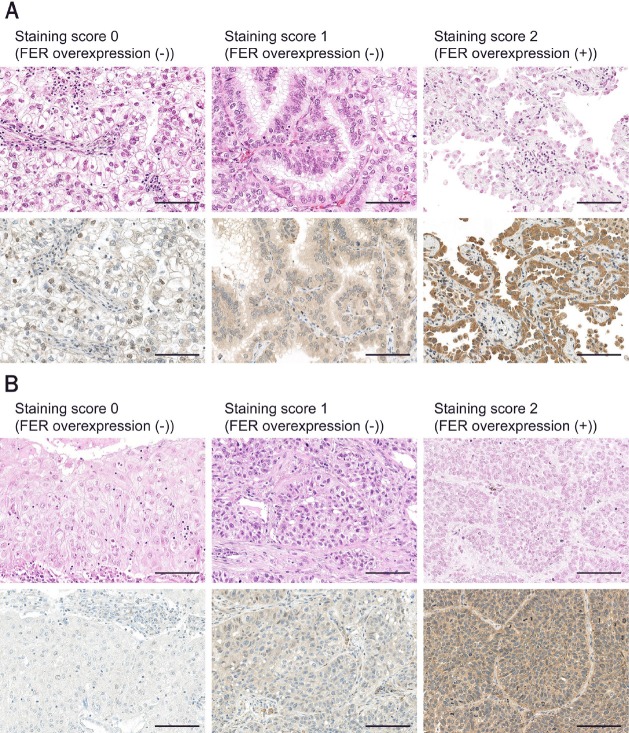
Figure 2.
Immunohistochemical analysis of FER on NSCLC tumor microarrays. Representative images of each staining score in adenocarcinoma samples (A) and squamous cell carcinoma samples (B) are shown. The upper panels are hematoxylin and eosin staining, and the lower panels are immunostaining for FER. Scale bar, 100 μm.

