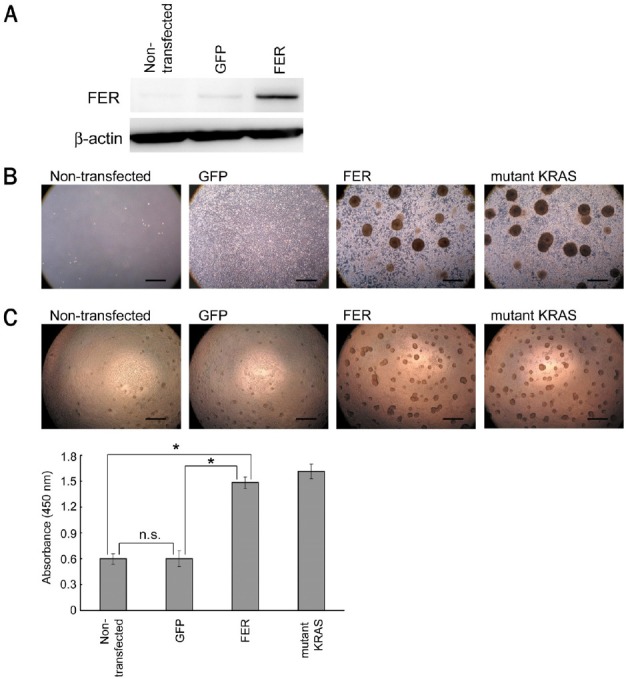
Figure 4.

Transforming activity of FER in vitro. A. Western blot analysis after the introduction of FER into NIH-3T3 cells. B. Focus formation assay. Representative images from non-transfected or transfected NIH-3T3 cells after selection using hygromycin are shown. Scale bar, 500 μm. C. Colony formation assay. The formed colonies were quantified according to the absorbance using WST-8 and are shown as a bar graph. The error bars indicate the standard deviations. Scale bar, 500 μm. n. s., not significant. *P < 0.001.
