
Figure 4.
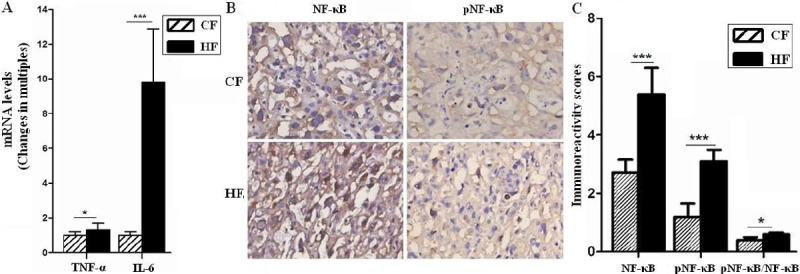
HF stimulated inflammatory response in placentas. The mRNA levels of TNF-α and IL-6 were analyzed by quantitative real-time PCR (A), and the expression of NF-κB and pNF-κB in placentas of GD18.5 were analyzed by immunohistochemistry (B and C), respectively. The mean fold change of target genes was normalized to GAPDH. Original magnification: ×400. Error bars depict the standard error of the mean. *P<0.05 or ***P<0.001 compared to the CF control.