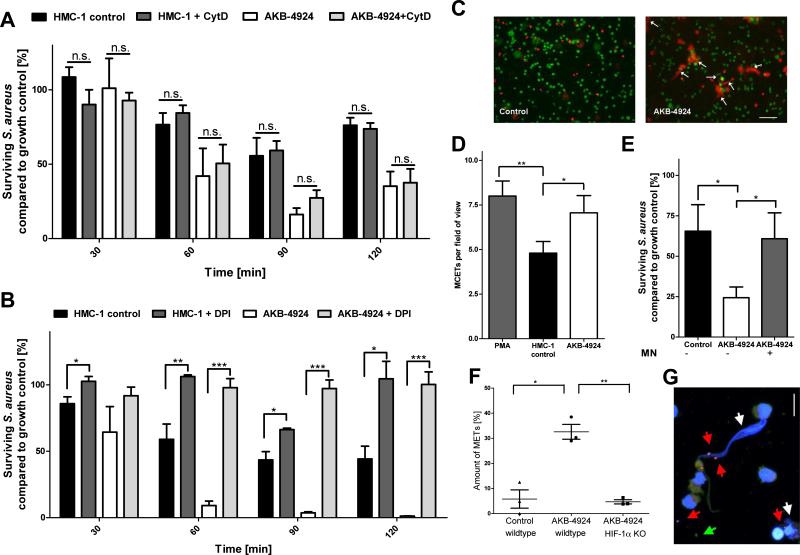
Figure 2. HIF-1α is mediating the extracellular antimicrobial activity of MCs.
(A) HIF-1α-mediated antimicrobial activity of HMC-1 cells against S. aureus via extracellular mechanism. HMC-1 cells were treated with 10 μM AKB-4924 or vehicle control to boost HIF-1α-signalling (1 h prior to infection) and 10 μg/ml cytochalasin D to block phagocytosis (10 min prior to infection). (B) HIF-1α-mediated antimicrobial activity of HMC-1 cells against S. aureus is ROS-dependent. HMC-1 cells were treated with 10 μM DPI to block NADPH-oxidase-dependent formation of ROS simultaneously with 10 μM AKB04924 to boost HIF-1α-activity. (C) Boosting of HIF-1α with AKB-4924 results in the induction of MCETs. Representative fluorescent images of MCETs, stained with Live/Dead viability/cytotoxicity kit for mammalian cells (staining cytoplasm of viable cells in green and DNA released by dead cells in red). The extracellular deposition of DNA is indicated by white arrows. Bar 25 μm. (D) MCETs were counted per field of view with approximately 125 MCs after stimulation for 2.5 h with 10 μM AKB04924, vehicle control or 1.5 h with 25 nM PMA as positive control. (E) HMC-1 cells were treated with 10 μM A4924 or vehicle control to boost HIF-1α-activity and 500 mU/ml micrococcal nuclease (1 h prior to infection) to degrade MCETs. Then, HMC-1 cells were infected with S. aureus (MOI=1) for 90 minutes and the antimicrobial activity was measured. (F) AKB-4924 boosts the formation of MCETs of BMMCs derived from WT, but not from myeloid HIF-1α-deficient mice. Each data point shows the mean value of an independent experiment, using BMMCs from different individual mice. (G) Representative high resolution confocal fluorescent z-stack images of MCETs boosted with AKB-4924 and infected with S. aureus. Analysis of viable (green, green arrows) versus dead (red, red arrows) bacteria entrapped in MCETs (white arrows) as determined by the Live/dead BacLight viability assay. Bar 8 μm. All data in (A, B, D-F) are presented as percentage of surviving bacteria in comparison to bacterial growth control (100%). *p < 0.05; **p < 0.01; ***p < 0.005 by a paired t-test.

