
Figure 1.
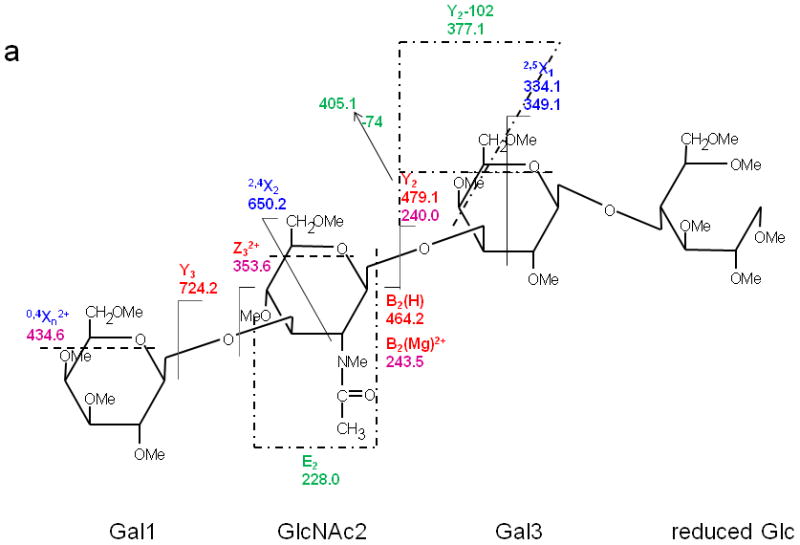
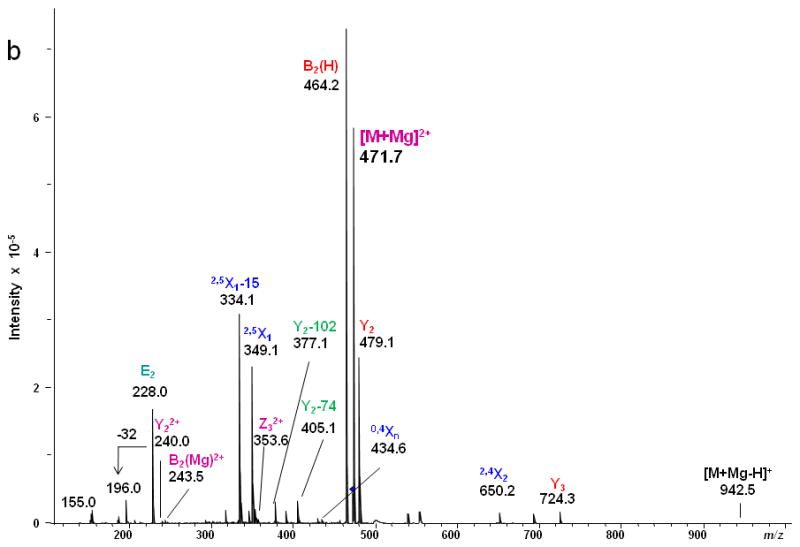
(a) CID MS/MS fragmentation of reduced and permethylated LNT [M + Mg]2+ m/z 471.7. (b) CID MS/MS spectrum. In this figure and all other figures, the ions that result from glycosidic cleavages have been labeled in red; those that originate from cross-ring cleavages have been labeled in blue, and those from internal cleavages, in green. The peaks labeled in purple represent doubly-charged ions.