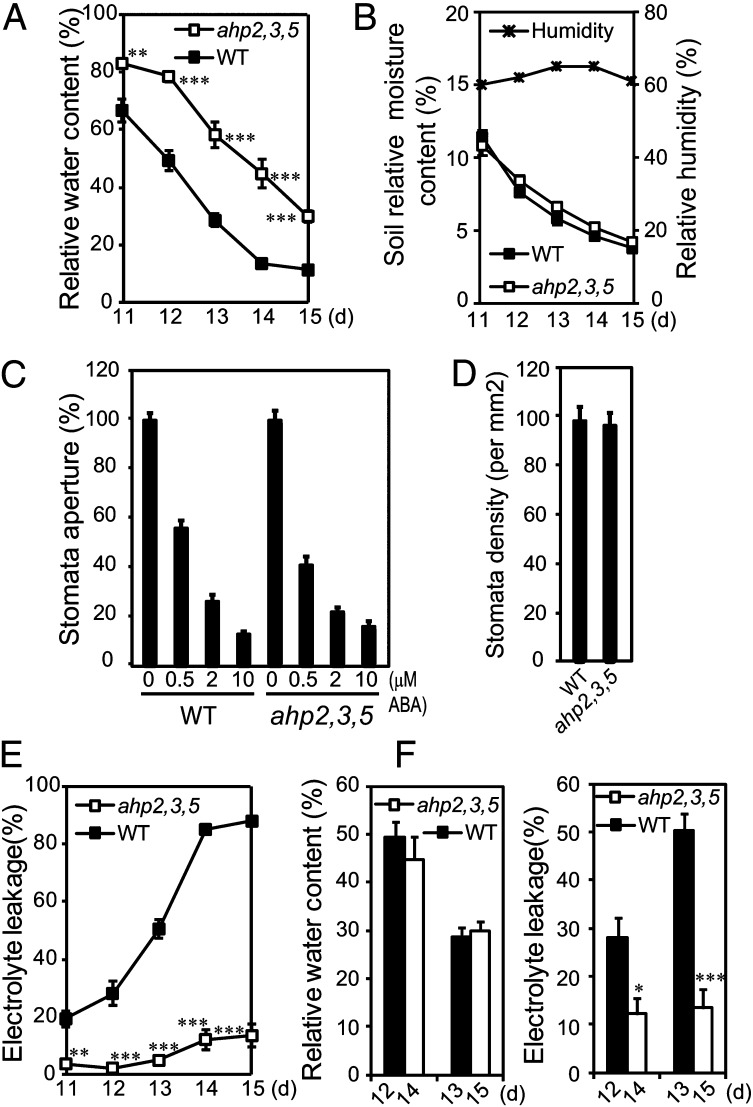
Fig. 3.
Comparison of RWC, electrolyte leakage, stomatal aperture, and density of WT and ahp2,3,5 plants. (A) The WT and ahp2,3,5 plants were grown and exposed to drought stress as described in Fig. 1 A and B. At the indicated time points, plants were harvested for measurement of RWC. Error bars represent SEs (n = 5). (B) Soil relative moisture contents and relative humidity were recorded just before sample collection for measurements of RWC and electrolyte leakage. (C) Average stomatal aperture of rosette leaves from 4-wk-old WT and ahp2,3,5 plants in the presence or absence of ABA. Error bars represent SEs (n > 28). (D) Average stomatal density of rosette leaves from 4-wk-old WT and ahp2,3,5 plants. Error bars represent SE (n = 25). (E) Electrolyte leakage of the WT and ahp2,3,5 plants exposed to drought stress as described in (A). Error bars represent SEs (n = 5). (F) Comparison of electrolyte leakage levels between WT and ahp2,3,5 plants collected at a similar RWC during drought stress. Error bars represent SE (n = 5). Asterisks indicate significant differences as determined by a Student’s t- test analysis (*P < 0.05, **P < 0.01, ***P < 0.001).

