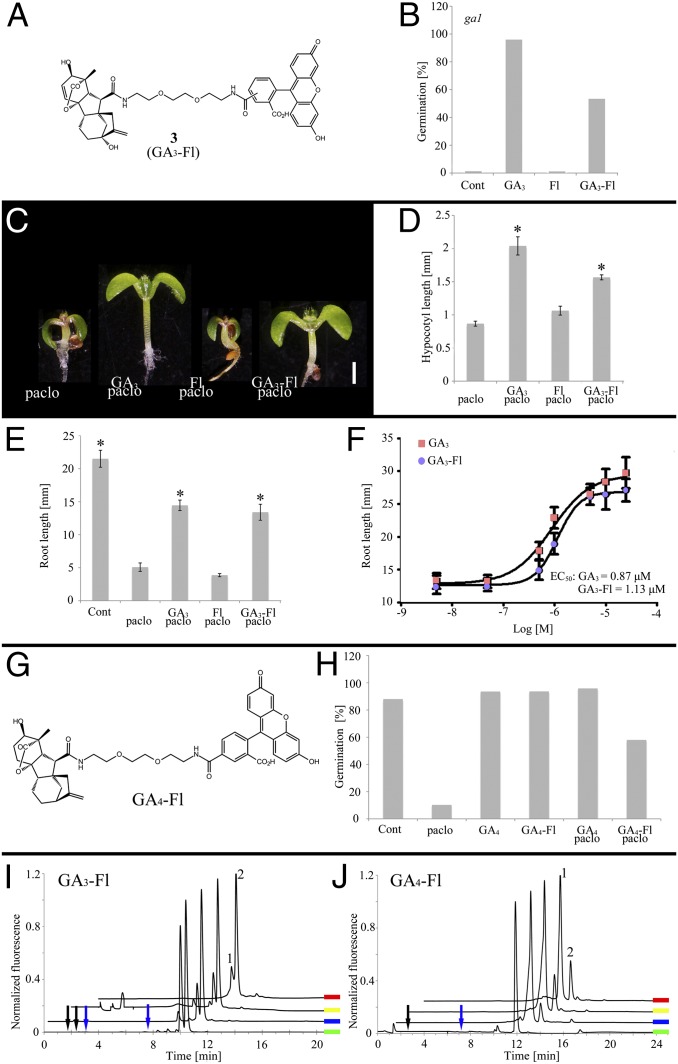
Fig. 1.
Characterization of labeled GAs. (A) Molecular structure of GA3-Fl. (B) Germination of GA biosynthesis mutant ga1 treated with GA3-Fl, Fl, or GA3 (100 μM). (C and D) Hypocotyl elongation of seedlings treated with Paclo (2 μM) plus GA3-Fl, Fl, or GA3 (10 μM). Shown are averages ± SE (n = 10). (D) Graphical representation of the experiment in C. (Scale bar, 1 mm.) (E) Root elongation of seedlings treated with Paclo and GA3-Fl, Fl, or GA3 (10 μM). Shown are averages ± SE (n = 10). (F) Response of Paclo-treated seedlings to increasing concentrations of GA3 and GA3-Fl (molecule 3). EC50 is for GA3 and GA3-Fl. Shown are averages ± SE (n = 10). (G) Molecular structure of GA4 labeled with Fl. (H) Effects of Paclo (2 μM) and GA4-Fl or GA4 (10 μM) on germination of WT seeds. Shown are averages ± SE (n = 70). (I and J) Fluorescence HPLC chromatograms of root extracts from GA3-Fl–treated (I) or GA4-Fl–treated (J) plants and reference compounds. Green, reference molecule; blue, 1-d root extract; yellow, 2-d root extract; red, 3-d root extract. (I) Peaks 1 and 2 elute similarly to the GA3-Fl isomer reference and were further identified by HRMS. (J) Peak 1 elutes similarly to GA4-Fl reference and was further identified by HRMS. Peak 2 is an unidentified GA4-Fl adduct. Arrows point to retention times expected for GA3-Fl and GA4-Fl cleavage products: blue: C6 amide, black: 5- and 6-carboxyfluorescein (SI Appendix, Fig. S10E). *Significantly different relative to respective Paclo treatment at P ≤ 0.001 by Student t test.

