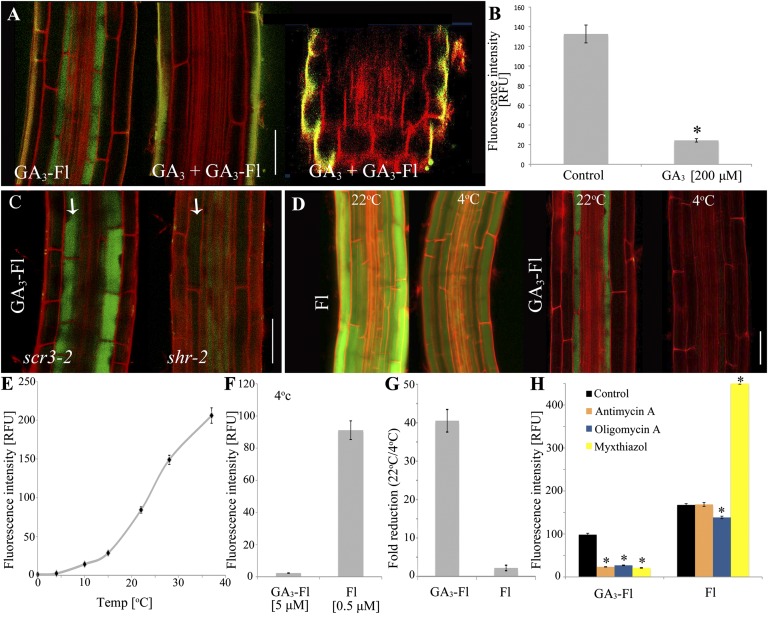
Fig. 4.
GA3-Fl is actively transported into the elongating endodermal cells. (A) Distribution of GA3-Fl (5 μM) in the root elongation zone in the absence or presence of competing GA3 (200 μM). At the far right is a radial confocal section of the elongation zone under competing conditions (compare with Fig 2D). (B) Quantification of the competition assay described in A. Fluorescence intensity was measured in the elongating endodermal cells. Shown are averages ± SE (3 root images, 10 cells/image, 2 sampling points/cell; n = 60) (SI Appendix, Fig. S18). (C) GA3-Fl distribution in the elongation zone of the scr3-2 and shr-2 mutants. White arrows indicate the single cortex/endodermal layer. (D) Temperature dependence of Fl and GA3-Fl accumulation in the elongation zone. Fl (0.5 μM) and GA3-Fl (5 μM) were applied for 2 h at either 4 °C or 22 °C. (E) Fluorescence intensity in elongating endodermal cells in plants treated with GA3-Fl (5 μM) for 2 h at the indicated temperature. Shown are averages ± SE (n = 60). (F) Fl and GA3-Fl applied for 2 h at 4 °C. Fluorescent intensity was measured as described in B. (G) Fold change in fluorescence intensity of Fl (0.5 μM) and GA3-Fl (5 μM) applied to seedlings exposed to 4 °C compared with 22 °C. Fluorescence intensity was measured as described in B. (H) ATP synthesis inhibitors antimycin A, oligomycin A, and myxothiazol disrupt GA3-Fl but not Fl accumulation in the elongation zone. Seedlings were treated with 10 μM of the indicated inhibitor for 1.5 h and transferred to plates with inhibitor + GA3-Fl or Fl (5 μM and 0.5 μM, respectively) for an additional 1.5 h. Fluorescence intensity was measured in the elongating endodermal cells. Shown are averages ± SE (n = 60). *Significantly different relative to the respective control at P ≤ 0.001 by Student t test. (Scale bars, 50 μm.)

