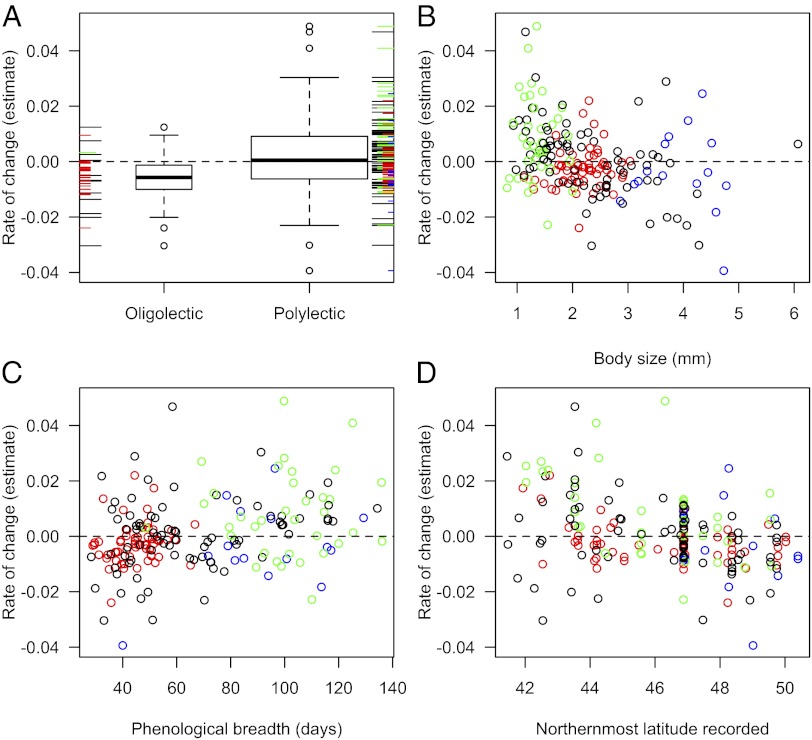
Fig. 3.
Relationships among species traits, phylogeny, and rates of change in relative abundance over time. The three most speciose genera are colored to demonstrate how traits are often shared among species within a genus: Bombus (blue), Andrena (red), and Lasioglossum (green). (A) Dietary breadth (floral specialization); boxplot width is proportional to number of species and individual species values are indicated along each side. (B) Body size measured as the intertegular distance (mm). (C) Phenological breadth (days of adult activity per year). (D) Northern distributional limit (degrees latitude).

