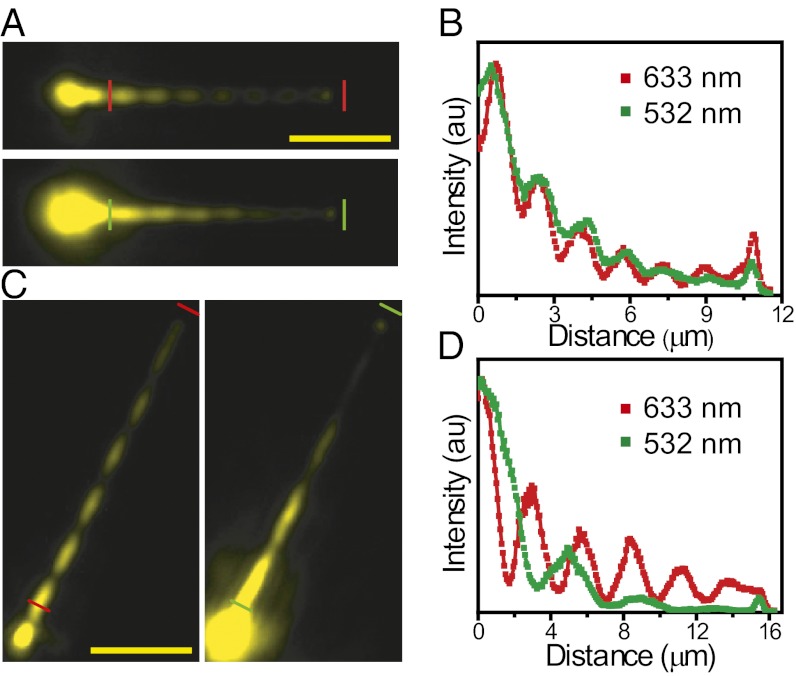
Fig. 5.
Near-field distribution for different excitation wavelengths. (A) QD emission images for a 140-nm radius NW coated with 30 nm of Al2O3 for an excitation wavelength of 633 nm (Upper) and 532 nm (Lower). (B) The intensity profiles along the NW between the short bars in A, which are obtained by plotting the intensity of single pixels along the NW as a function of the distance. The intensity is normalized by the maximum of the two curves. (C and D) The corresponding data for a 135-nm radius NW coated with 50 nm of Al2O3. (Scale bars, 5 µm.)

