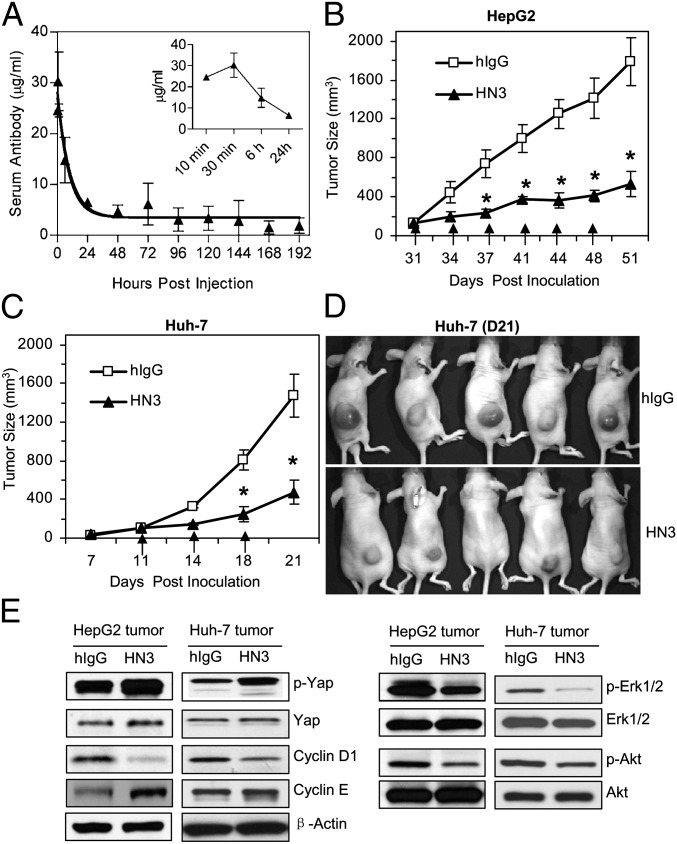
Fig. 7.
Inhibition of HCC xenograft tumor growth by HN3 antibody. (A) Pharmacokinetics of HN3 antibody. Serum concentrations of the antibody were measured by ELISA following a single i.v. injection of 3 mg/kg. The serum antibody concentration data were fitted with a two-compartment model using Phoenix WinNonlin software. The observed mean serum antibody concentration (in micrograms per milliliter) ± SD of four animals for each time point was plotted as a function of time. (B) Inhibition of HepG2 cells inoculated into nude mice. After the tumor size reached 100 mm3, HN3 antibody or hIgG control was delivered i.v. at 60 mg/kg body weight, twice a week. Arrows indicate antibody injections. Error bars indicate SE. *P < 0.05, HN3 vs. hIgG in B and C. (C) Inhibition of Huh-7 cells. Experimental settings are as in B. (D) Photographs of a representative group of mice treated with HN3 antibody. hIgG is pooled human IgG used as control. (E) Western blot analysis of molecular changes in HN3-treated and control tumors.

