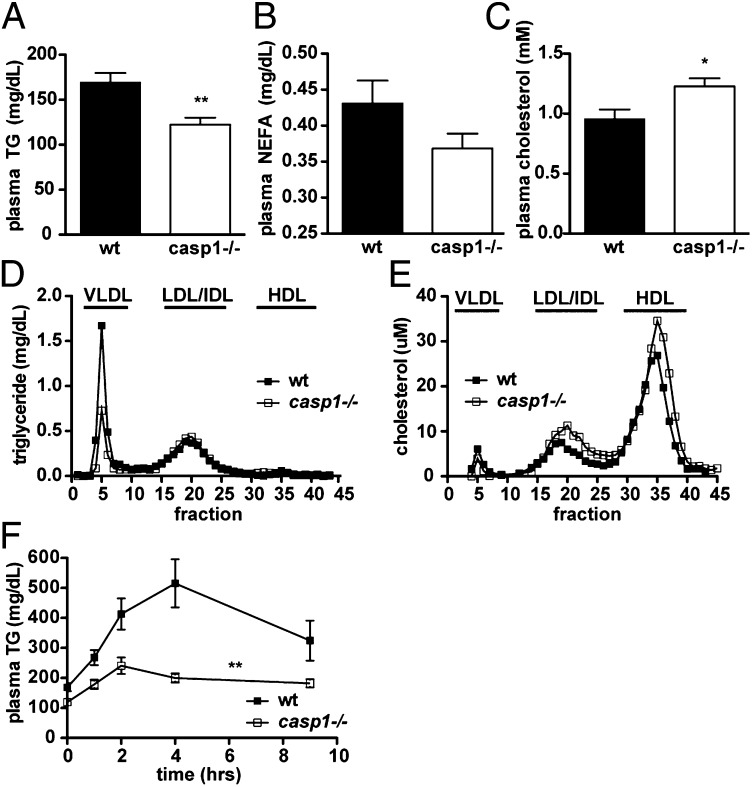
Fig. 1.
Chow-fed casp1−/− mice have altered lipid homeostasis. (A) Fasting plasma TG (data shown represent a combination of multiple independent experiments, with n > 26 per group), (B) NEFA (P = 0.1, n = 14 per group), and (C) fasting cholesterol (n = 6–7 per group). (D and E) Distribution of (D) cholesterol and (E) TG in fasting plasma samples separated by FPLC (pooled from 8 to 10 per group). (F) Plasma TG after an oral fat tolerance test (n = 17–19 per group).*P < 0.05; **P < 0.001. Error bars represent SEM.

