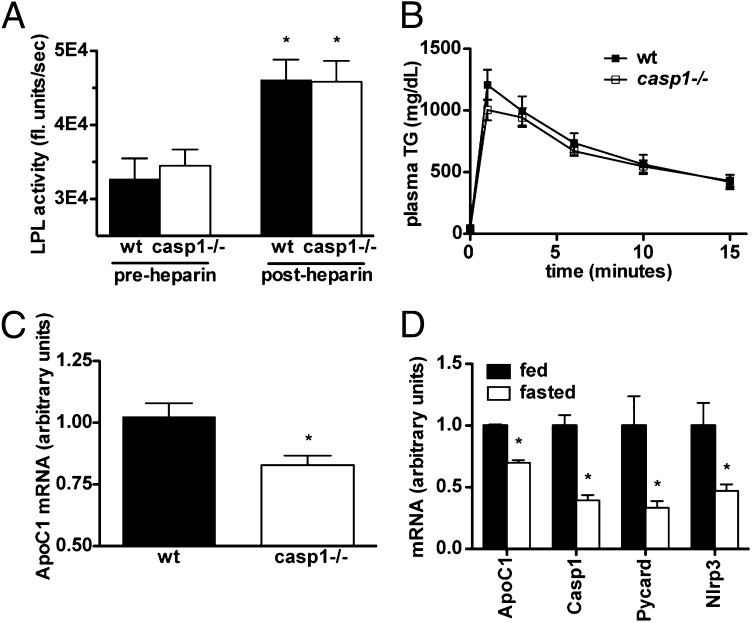
Fig. 3.
Clearance may depend on lipoprotein composition, but not LPL activity. (A) LPL activity measured in postheparin plasma on an artificial TG emulsion (n = 5–6 per group) (*vs. preheparin plasma). (B) Plasma TG measured during an i.v. fat tolerance test (n = 6–9 per group). (C) Hepatic ApoC1 mRNA expression (n = 15–16 per group). (D) mRNA expression of ApoC1, Casp1, Pycard (ASC), and Nlrp3 in overnight-fasted vs. ad libitum fed WT mice (n = 4 per group). *P < 0.01. Error bars represent SEM.

