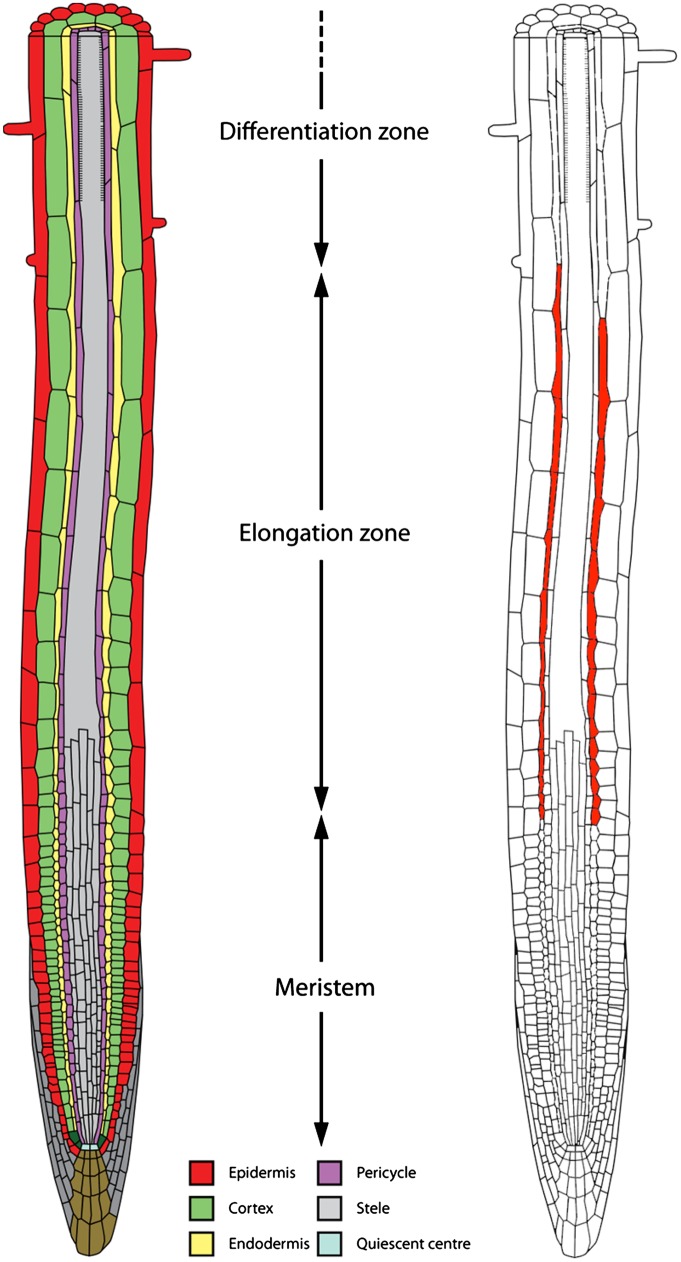
Fig. 1.
Schematic illustrations of (Left) the tissue organization and zones within the Arabidopsis primary root, and (Right) the cellular distribution of the hormone signal GA. The concentric layers of epidermal, cortical, endodermal, pericycle, and stele (vascular) tissues are color coded (see key); the GA distribution is denoted in red.

