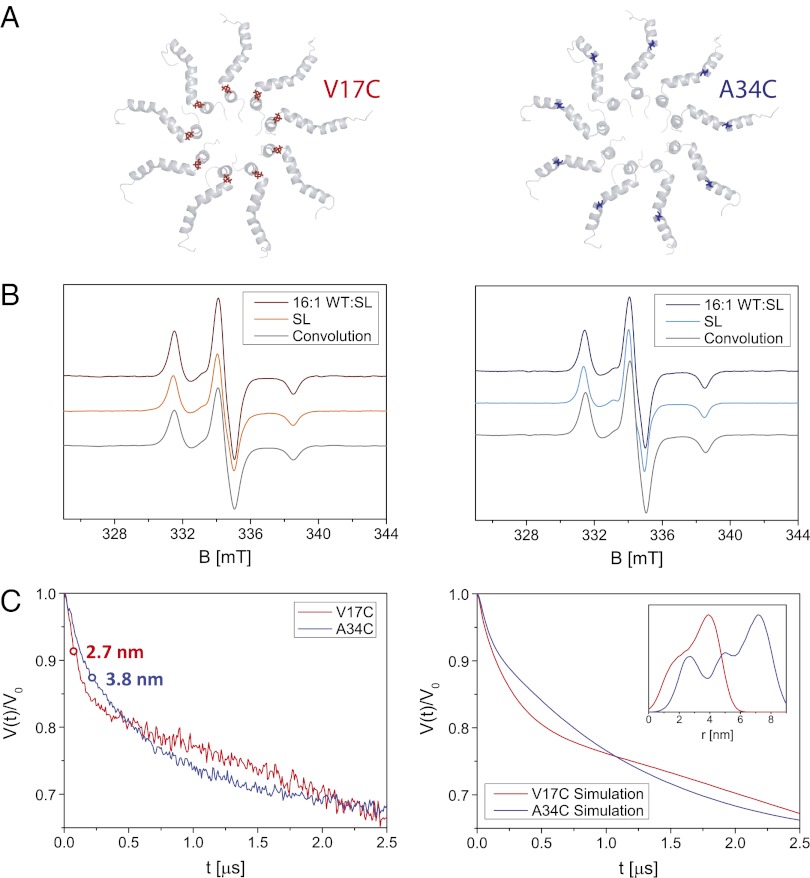
Fig. 4.
(A) Cartoon of the 9-mer structure of oligomeric TatA from the cytoplasmic side of the membrane with highlighted amino acid positions used for spin labeling, Val17 in red (Left) and Ala34 in blue (Right). (B) Cw EPR spectra recorded at 170 K on oligomeric TatA samples (DPR of 30) for different relative concentrations of wild-type (WT) and spin-labeled (SL) protein for TatA labeled in position 17 (Left) and 34 (Right). Experimental conditions: 9.40 GHz microwave frequency, 0.1 mT modulation amplitude. The convolution of the 16:1 wild-type to spin-labeled EPR spectrum with the distance distribution obtained from the model of the 9-mer is shown in gray. (C) Four- and three-pulse DEER data recorded for oligomeric TatA labeled at position 17 (red line) or 34 (blue line) for a sample with 4:1 wild-type to spin-labeled protein and combined using the DEER-Stitch procedure (50) (Left). The individual four- and three-pulse DEER traces are shown in Fig. S9. As a qualitative guide, the half-time (the time the reduced form factor takes to decay to half its maximum value) is indicated by a circle and related to the mean distance according to ref. 51 using DeerAnalysis (52). Simulations of the DEER data for distance distributions calculated for the model structure of the 9-mer labeled in position 17 (red line) or 34 (blue line) are shown (Right). The distance distributions are shown (Inset). Details on the calculation of the distance distribution and the simulations can be found in the SI Text.

