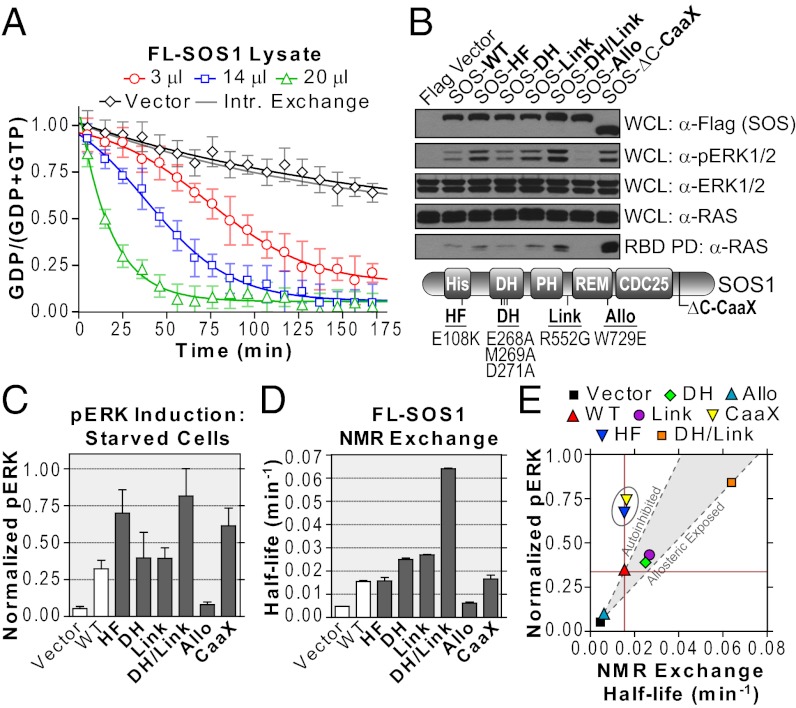
Fig. 4.
Monitoring activity of full-length SOS1 in cell extracts. (A) Titration of lysates containing wild-type SOS1 to 15N-RAS and 10-fold GTPγS. The fit shifts from a sigmoidal to an exponential model. Transfection of vector alone showed intrinsic exchange rate. (B) SOS1 mutants differentially activate the RAS/ERK pathway. Position of mutations noted in schematic (Lower). Membrane-targeted SOS1-ΔC-CaaX was a control. Immunoblots show expressed SOS1 (anti-Flag), activated ERK (anti-pERK), loaded ERK (anti-ERK), loaded RAS (anti-RAS), and activated RAS (GST-BRAF RBD pull-down, anti-RAS) in serum-starved cells. Results are representative of multiple repeated experiments. (C) Quantification of ERK activation using densitometry. One-way ANOVA confirms a significant difference in mean pERK levels (P < 0.05). (D) Quantification of NMR-derived SOS1 exchange activity. Lysates were normalized for SOS1 expression. One-way ANOVA confirms a significant difference in mean exchange activities (P < 0.05). (E) Plot correlating ERK activation in starved cells vs. intrinsic exchange as measured by NMR. A region correlating with allosteric control was extrapolated from vector alone through SOS1-WT (autoinhibited) and SOS1-DH/Link (allosteric-exposed). The SOS1-HF and CaaX proteins lay outside of the area (circled). Also see Figs. S3 and S4.

