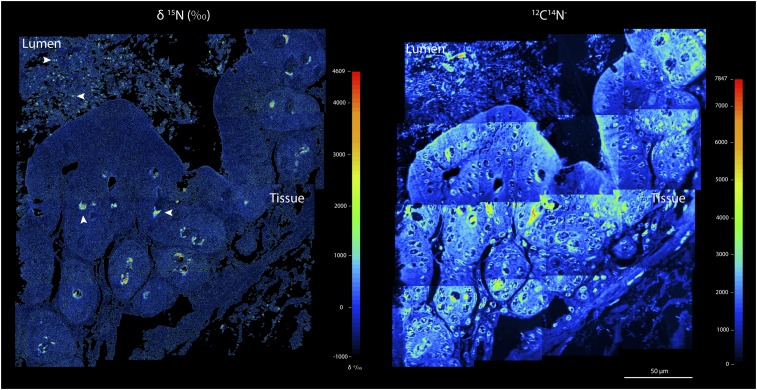
Fig. 1.
Imaging 15N enrichment (δ15N) in the cecum tissue and intestinal lumen 8 h after i.v. injection of 13C,15N threonine. A mosaic of 16 individual high-resolution NanoSIMS images is shown. 12C14N− secondary ion intensity distribution images of the same area are shown to illustrate the structure of the tissue and lumen biomass. 15N hotspots are indicated by white arrows. The patchy distribution of 15N hotspots in the tissue is likely attributable to the heterogeneity in mucus release activity both within and between mucus cells (24, 25).

