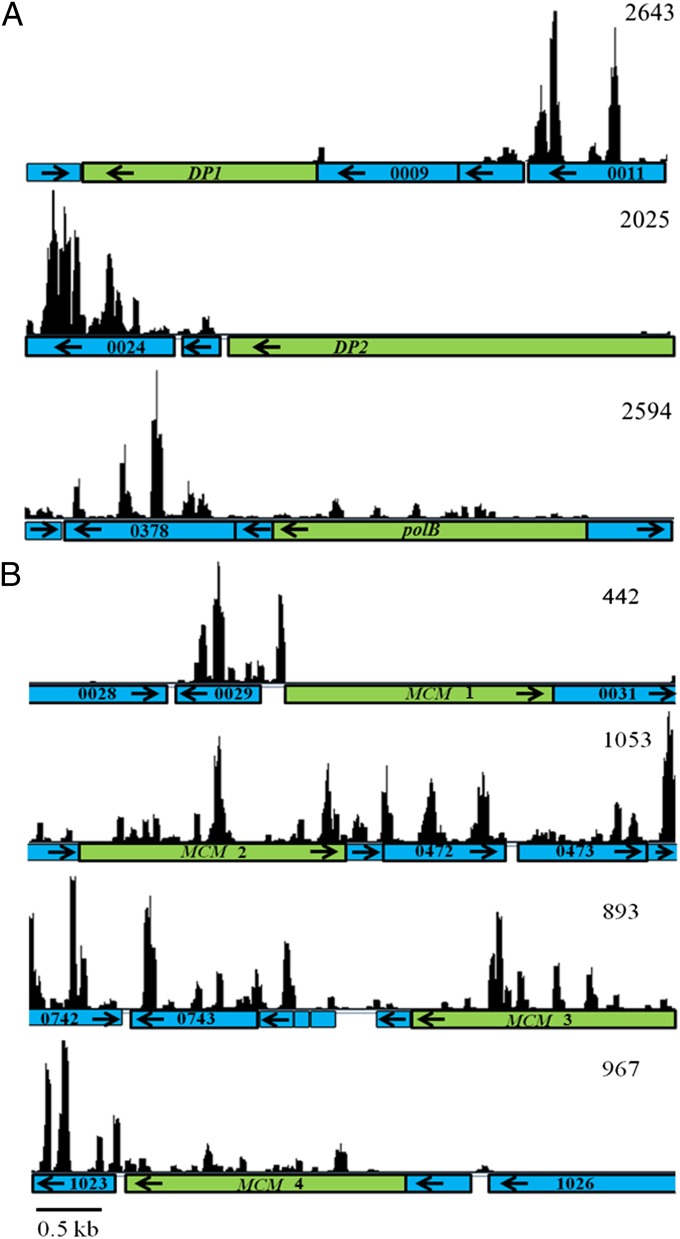
Fig. 3.
Distribution of reads across selected genes of the M. maripaludis S2 genome. The y axis is the number of reads within a window size of three. The numbers in the top right corners represent the maximum number of reads in each segment. (A) The DP1 and DP2 genes (green) encode the small and large subunits of DNA polymerase type II (PolD), respectively. polB (green) encodes DNA polymerase B (PolB). (B) The four homologs for the MCM genes (green), which encode the minichromosome maintenance proteins. Surrounding genes are represented in blue. Numbers indicate the MMP identification, and arrows indicate the direction of transcription. Initial plots were generated using Artemis.

