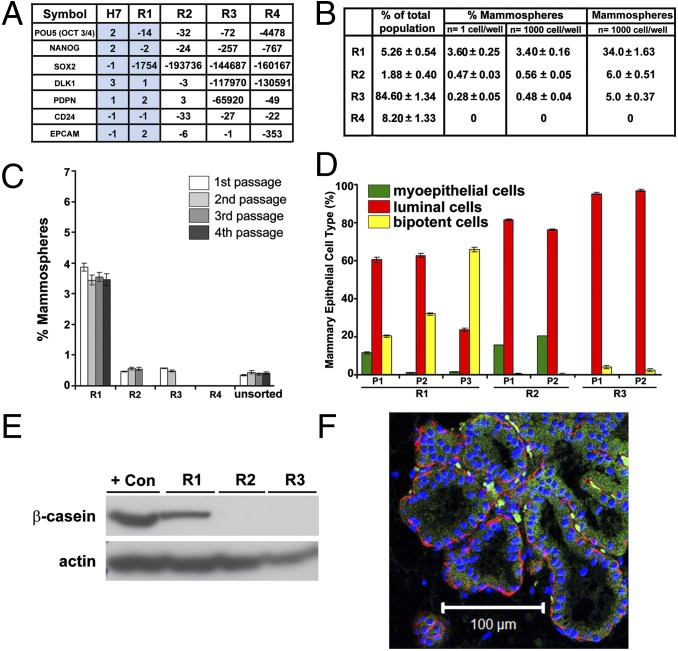
Fig. 1.
Assessment of R1 for ectodermal multilineage potential. (A) Expression of multi- and pluripotency-associated genes in directly sorted R1–R4 subpopulations (n = 4) and hESC H7 (n = 3) assayed by qPCR array. Results are expressed as fold changes compared with hESC H9 (n = 3) and normalized to the housekeeping gene GAPDH. Blue shading highlights the similarities in gene expression levels for H7 and R1. (B) Distribution of R1–R4 subsets within the total epithelial population and ability to form mammospheres from either 1 cell or 1,000 cells. Results are expressed as averaged mean and percentages ±SEM (n = 10). Individual values are shown in Dataset S1. (C) Mammosphere initiating capacity for R1–R4 subpopulations was assessed using 10,000 cells (first passage) and 1,000 cells (subsequent passages) (n = 5). Actual values are shown in the legend of Fig. S3A. (D) Distribution of myoepithelial (α-6-integrin/CD49f+), luminal (MUC-1+), and bipotent (α-6-integrin/CD49f+ and MUC-1+) cells assessed by FACS after dissociation of colonies derived from successive passages of mammospheres. P, passage. Quantitative data are shown in the SI Methods. (E) Human β-casein expression in R1–R3 mammosphere-derived cells by Western blot analysis. Loading control: actin. Positive control: BT-20 cell line. (F) Ducts consisting of a luminal layer expressing CK8/18 (green) and a myoepithelial layer expressing α-SMA (red) stained with human-specific antibodies documenting the human origin of R1-derived structures formed in mouse fat pads. (Scale bar, 100 µm.)

