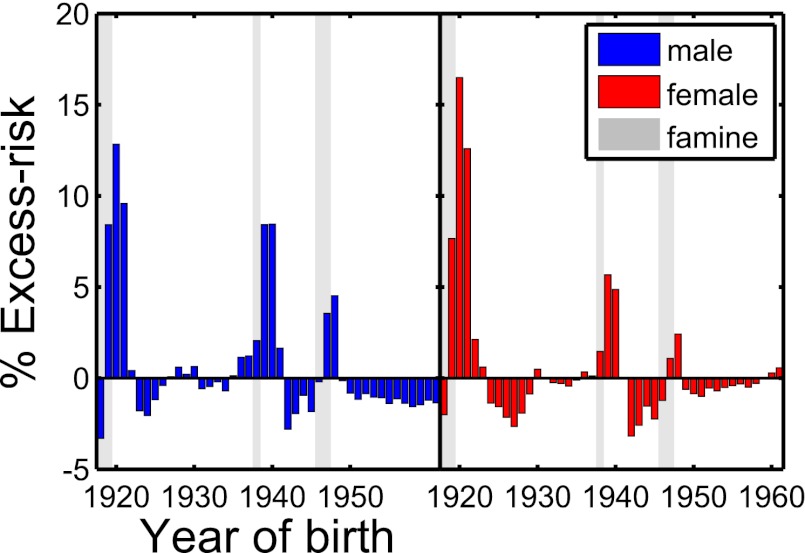
Fig. 2.
Excess risk of diabetes patients divided into genders between 1917 and 1961 for the Austrian data. The excess risk is defined as the difference of the value of the diabetes risk (Fig. 1) and the trend line for any given year of birth. The gray areas indicate the three famines.

