Fig. 1.
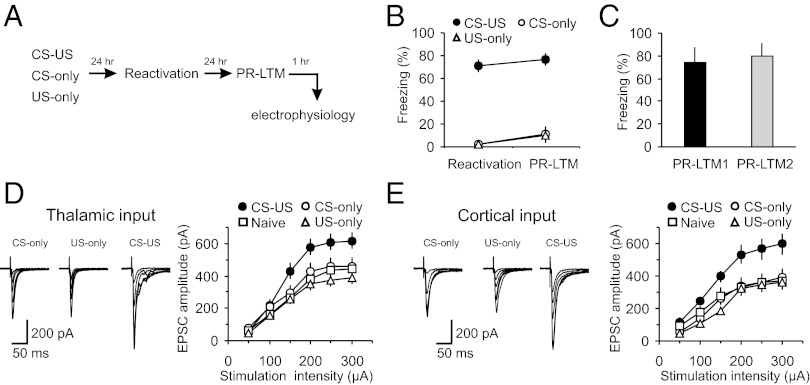
Fear conditioning leads to synaptic enhancements in cortical and thalamic inputs to the LA. (A) A schematic representation of the experimental design. Rats were trained in a single-trial fear conditioning paradigm and tested at 24 h (PR-LTM) after reactivation trials. (B) Percent freezing observed in fear-conditioned rats (CS–US, paired) and in rats that received CS or US only (CS–US, n = 22 rats; CS-only, n = 20 rats; US-only, n = 6 rats). There were no differences between freezing responses at reactivation and PR-LTM in the CS–US (P = 0.47), CS-only (P = 0.15), or US-only (P = 0.35) groups. (C) Percent freezing observed in CS–US rats at PR-LTM1 (a first reactivation trial) and PR-LTM2 (a second memory test performed 24 h after PR-LTM1) (n = 5 rats; paired t test, P = 0.51 for PR-LTM1 versus PR-LTM2). (D, Left) Averaged EPSCs evoked in thalamic input to the LA by presynaptic stimuli of increasing intensity in slices from naïve (10 rats), CS-only, US-only, and paired groups of rats. Traces are averages of 10 EPSCs. (D, Right) Synaptic input–output curves obtained in thalamic input to the LA (naïve, n = 26 neurons; CS-only, n = 16 neurons; US-only = 12 neurons; paired, n = 14 neurons). Peak amplitudes of the EPSCs were significantly different between naïve, CS-only, US-only, and paired groups (two-way ANOVA, P < 0.001). Post hoc Bonferroni’s simultaneous multiple comparisons revealed significant differences in the EPSC amplitudes between naïve and paired groups (P < 0.001), between CS-only and paired groups (P < 0.01), and between US-only and paired groups (P < 0.001). Thus, synaptic strength in thalamic input was enhanced in fear conditioned rats (paired group). (E) In cortical input, peak amplitudes of the EPSCs also differed significantly between naïve (n = 16), CS-only (n = 8), US-only (n = 12), and paired (n = 12) groups (two-way ANOVA, P < 0.001). EPSC amplitudes were larger in the paired group compared with either naïve (P < 0.001), CS-only (P < 0.001), or US-only group (P < 0.001; Bonferroni’s simultaneous multiple comparisons). Results are shown as means ± SEM.

