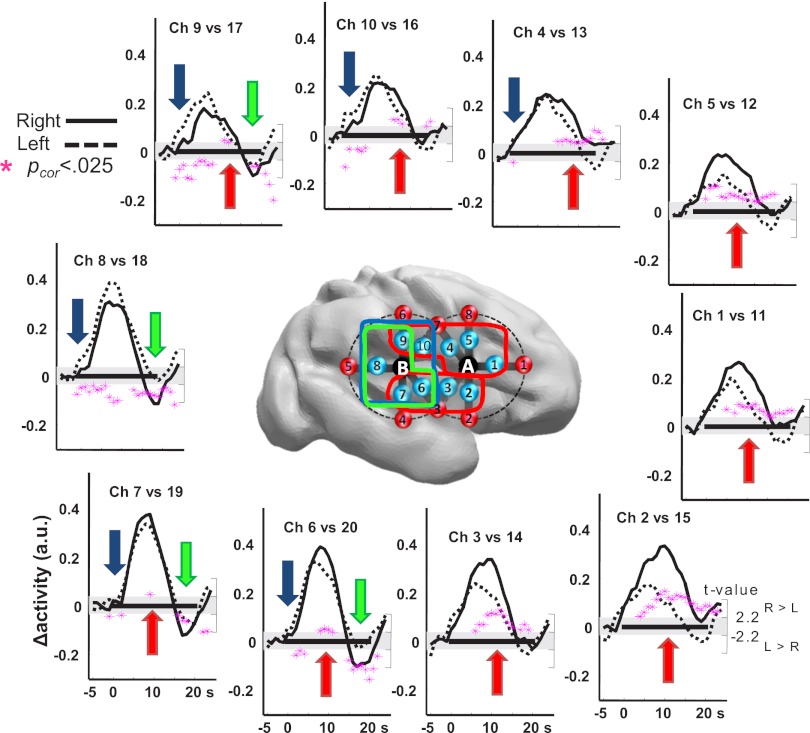
Fig. 2.
Functional asymmetry to speech sounds in premature infants. The right and left grand average HbO responses to all conditions are plotted for symmetrical channels, whose locations are presented over a right hemisphere view of a preterm brain. The black rectangle along the x axis indicates the duration of the stimulation block (0–20 s). Pink stars indicate the t-value of the samples (right scale) included in significant clusters (Pcor < 0.025). Values are positive when right > left and negative for the opposite direction. The four significant temporo-spatial clusters are identified by colored arrows on the plots and lines surrounding the channels on the brain. Responses are larger on the right hemisphere (red clusters) but are faster (blue cluster) and last longer (green cluster) in the posterior left regions.

